


(C) 2011 Huzefa A. Raja. This is an open access article distributed under the terms of the Creative Commons Attribution License, which permits unrestricted use, distribution, and reproduction in any medium, provided the original author and source are credited.
For reference, use of the paginated PDF or printed version of this article is recommended.
The Ascomycota are a group of filamentous fungi that occur as saprobes, pathogens, and symbionts. They are of immense industrial, medical, ecological, and economical importance. The search for new markers appropriate for molecular phylogenetic analysis of Ascomycota remains a challenging problem. In this study, we explore the phylogenetic utility of a single copy protein-coding gene, MCM7; newly recognized as useful for inferring phylogenetic relationships among the major classes of the Ascomycota. Our specific goals were to: 1) test the phylogenetic utility of MCM7 for estimating phylogenies at various taxonomic ranks (class and below) with an emphasis on non-lichenized ascomycetes; and, 2) compare the congruence, robustness and resolving power of MCM7-based phylogenies with that of nuclear large subunit rDNA (LSU)-based phylogenies for the same taxon set. A dataset of sequence data for MCM7 as well as LSU was assembled for 80 species belonging to 63 genera of lichenized and non-lichenized ascomycetes in the classes Dothideomycetes, Eurotiomycetes, Geoglossomycetes, Lecanoromycetes, Leotiomycetes, and Sordariomycetes. We obtained 93 new sequences of which 65 are MCM7 and 28 are LSU. Maximum-Likelihood and Bayesian analyses were performed using single as well as combined gene datasets and partitions. We also assessed substitution saturation for the MCM7 gene. Results indicate that MCM7 can be used successfully for determining phylogenetic relationships of ascomycetes and provided good resolution and support at half the cost compared to LSU. Phylogenetic informativeness profiles showed that MCM7 was more phylogenetically informative than LSU. The MCM7 gene is also a valuable phylogenetic marker for both lower as well as higher level phylogenetic analyses within the Ascomycota, especially when used in combination with the LSU gene. We found that although the third codon position of MCM7 is saturated, it was better to analyze the dataset with all codon positions included. Phylogenetic performance of MCM7 with and without the third codon position is discussed.
Fungi, Leotiomyceta, MS456, non-lichenized ascomycetes, systematics, 28S nrDNA
The Ascomycota, commonly referred to as the sac-fungi (
Early fungal phylogenetic studies used DNA sequences from
nuclear ribosomal genes such as small subunit (18S) and large subunit
(28S) rDNA genes (
Phylogenetic relationships among taxa of Ascomycota (
Despite their widely accepted use in inferring
evolutionary relationships among the ascomycete fungi, a number of
protein-coding genes have been shown to perform variably (
The major objectives of this study, therefore, were to: 1) test the phylogenetic utility of MCM7 for estimating phylogenies at various taxonomic ranks (class and below) with a focus on non-lichenized ascomycetes; 2) expand use of the MCM7 gene to include taxa in the Dothideomycetes, Geoglossomycetes, Leotiomycetes, and Sordariomycetes; and, 3) compare the congruence, robustness and resolving power of MCM7-based phylogenies with that of LSU-based phylogenies for the same taxon set. Comparing the phylogenetic utility of the new gene with that of existing ones helps build robust and well-resolved phylogenies among ascomycete fungi while improving cost management of molecular studies.
Materials and methods Taxon samplingTaxa used in this study are listed in Table 1,
along with information on the source of the isolates as well as their
country of origin, where available. The focus of our taxon sampling was
to include non-lichenized ascomycetes representing terrestrial and
freshwater ascomycete taxa from the Dothideomycetes, Geoglossomycetes, Leotiomycetes, and Sordariomycetes for both MCM7
and LSU genes. We assembled datasets of each gene for the same 89 taxa.
Six classes from within the rankless taxon Leotiomyceta (
Species used in this study along with their source, localities and accession numbers.
| Taxon | Source** | Locality | GenBank Accession Numbers | |
|---|---|---|---|---|
| 28S nuc-rDNA | MCM7 | |||
| Ajellomyces capsulatus | GenBank/Genome | – | AAJI01002781 | XM_001538714 |
| Aliquandostipite crystallinus | F83-1 | USA | GU266239 | JN672963 |
| Aliquandostipite khaoyaiensis | AF276-1 | Costa Rica | JN673028 | JN672964 |
| Aliquandostipite khaoyaiensis | F89-1 | USA | EF175647 | JN672965 |
| Aliquandostipite khaoyaiensis | CBS 118232 | Thailand | GU301796 | JN672966 |
| Alternaria alternata | CBS 916.96 | – | DQ678082 | JN672967 |
| Anguillospora longissima | CCM-F10304 | – | JN673029 | JN672968 |
| Anguillospora longissima | CS869-1D | USA | GU266240 | JN672969 |
| Apiosporina collinsii | CBS 118973 | – | GU301798 | JN672970 |
| Arctomia delicatula | GenBank | Sweden | AY853355 | GQ272388 |
| Arctomia teretiuscula | GenBank | China | DQ007346 | GQ272389 |
| Aspergillus clavatus | GenBank/Genome | – | AF454152 | XM_001275314 |
| Aspergillus fumigatus | GenBank/Genome | – | AAHF01000000 | XM_750254 |
| Aspergillus niger | GenBank | – | NT_166520 | XM_001397760 |
| Aspergillus oryzae | GenBank | – | AP_007172 | XM_001826176 |
| Aspicilia caesiocinerea | GenBank | USA | DQ780303 | GQ272390 |
| Aspicilia cinerea | GenBank | USA | DQ780304 | GQ272390 |
| Bisporella citrina | VPH-IL0501 | USA, IL | JN673031 | JN672971 |
| Botryotinia fuckeliana | GenBank/Genome | – | AAID01003173.1 | XM_001556412 |
| Brachiosphaera tropicalis | E192-1 | Panama | EF175653 | JN672972 |
| Bulbothrix apophysata | GenBank | Costa Rica | EU562670 | GQ272392 |
| Camarops polysperma | Hanson 2006-747 | Sweden | JN673030 | JN672973 |
| Camarops lutea | Hanson 2008-222 | Sweden | JN673032 | JN672974 |
| Camarops plana | Pouzar s.n. | – | JN673033 | JN672975 |
| Camarops scleroderma | MP 4464 | Panama | JN673034 | JN672976 |
| Camarops sp. | CH 08-570 | China | JN673035 | JN672977 |
| Cercophora aquatica | JF 06314 | France | JN673036 | JN672978 |
| Cercophora arenicola | ANM1080 | GSMNP | JN673037 | JN672979 |
| Cercophora sp. | JF 09214 | France | JN673038 | JN672980 |
| Chaetomium globosum | GenBank | – | AAFU01000612 | XM_001220296 |
| Chaetosphaeria lateriphiala | ANM1079 | GSMNP | JN673039 | JN672984 |
| Chlorencoelia torta | ANM2124 | GSMNP | JN673040 | JN672985 |
| Coccidioides immitis | GenBank/Genome | – | AAEC03000009 | XM_001240385 |
| Coniochaeta sp. | ANM1174 | GSMNP | JN673041 | JN672986 |
| Corynespora casiicola | CBS 100822 | – | GU301808 | JN672981 |
| Creosphaeria sassafras | ANM1978 | Indiana | JN673042 | JN672987 |
| Cudoniella clavus | ANM2087 | GSMNP | JN012006 | JN672988 |
| Delitschia winteri | CBS 116.29 | – | DQ678077 | JN672982 |
| Dermatocarpon miniatum | GenBank | Germany | AY607733 | GQ272394 |
| Farlowiella carmichaelina | CBS 206.36 | GU301791 | JN672983 | |
| Geoglossum difforme | VPH 25 | GSMNP | JN673043 | JN672989 |
| Geoglossum difforme | ANM2169 | GSMNP | JN673044 | JN672990 |
| Geoglossum simile | ANM2173 | GSMNP | JN673045 | JN672991 |
| Gibberella zeae | GenBank/Genome | – | AACM02000312 | XM_387281 |
| Gloniopsis smilacis | CBS 114601 | – | FJ161174 | JN672992 |
| Graddonia coracina | ANM2018 | GSMNP | JN012009 | JN672993 |
| Graddonia coracina | Hanson 2007-208 | Sweden | JN012010 | JN672994 |
| Graddonia coracina | JF 09318 | France | JN012011 | JN672995 |
| Hyalorostratum brunneisporum | A573-2b | USA | HM191720 | JN672996 |
| Hymenoscyphus fructigenus | ASM10619 | Russia | JN673046 | JN672997 |
| Hypoxylon crocopeplum | ANM1118 | GSMNP | JN673047 | JN672998 |
| Jahnula aquatica | R68-1 | USA | EF175655 | JN672999 |
| Jahnula bipileata | MYA 4173 | USA | EF175657 | JN673000 |
| Jahnula bipileata | AF220-1 | Ecuador | EF175656 | JN673001 |
| Jahnula rostrata | MYA 4176 | USA | EF175660 | JN673002 |
| Jahnula sangamonensis | MYA 4174 | USA | EF175662 | JN673003 |
| Jahnula sangamonensis | MYA 4175 | USA | EF175663 | JN673004 |
| Lachnellula sp. | ANM1992 | GSMNP | JN673048 | JN673005 |
| Lasiosphaeria lanuginosa | SMH3819 | – | AY436412 | JN673006 |
| Lasiosphaeria lanuginosa | SMH4925 | – | JN673049 | JN673007 |
| Lasiosphaeria ovina | ANM1295 | Louisiana | JN673050 | JN673008 |
| Lasiosphaeris hirsuta | ANM1066 | GSMNP | JN673051 | JN673009 |
| Leptosphaeria dryadis | CBS 473.64 | – | GU301828 | JN673010 |
| Lobothallia radiosa | GenBank | Switzerland | DQ780306 | GQ272397 |
| Magnaporthe grisea | GenBank/Genome | – | DQ493955 | XM_364455 |
| Megalohypha aqua-dulces | AF005-2a | Panama | EF175667 | JN673011 |
| Microthyrium microscopicum | CBS 115976 | – | GU301846 | JN673012 |
| Montagnula opulenta | CBS 168.34 | – | DQ678086 | JN673013 |
| Mycosphaerella punctiformis | CBS 113265 | – | DQ470968 | JN673014 |
| Myriangium hispanicum | CBS 247.33 | – | GU301854 | JN673015 |
| Mytilinidion mytilinellum | EB 0386 | – | GU397347 | JN673016 |
| Neosartorya fischeri | GenBank/Genome | – | EF669936 | XM_001260497 |
| Neurospora crassa | GenBank/Genome | – | AF286411 | XM_958785 |
| Phaeosclera dermatoides | CBS 157.81 | – | GU301858 | JN673017 |
| Psiloparmelia denotata | GenBank | Peru | EF105426 | GQ272413 |
| Pyrenula subpraelucida | GenBank | Costa Rica | DQ329015 | GQ272414 |
| Pyrgillus javanicus | GenBank | Australia | AY605078 | GQ272415 |
| Saccharomyces cerevisiae | GenBank | AB212638 | NM_001178550 | |
| Schizosaccharomyces pombe | GenBank | Z19136 | NP_596545 | |
| Scoria spongiosa | CBS 325.33 | DQ678075 | JN673018 | |
| Strossmayeria basitricha | ANM2055 | GSMNP | JN673052 | JN673019 |
| Sydowia polyspora | CBS 116.29 | – | DQ678085 | JN673020 |
| Teratosphaeria associata | CBS 112224 | – | GU301874 | JN673021 |
| Trichoglossum walteri | ANM2203 | GSMNP | JN673053 | JN673022 |
| Vibrissea filisporia f. filisporia | ANM2064 | GSMNP | JN012017 | JN673023 |
| Westerdykella angulata | CBS 610.74 | – | DQ384105 | JN673024 |
| Xylaria frustulosa | ANM1300 | Louisiana | JN673055 | JN673025 |
| Xylomyces chlamydosporus | H58-4 | USA | EF175669 | JN673026 |
| Xylomyces-like | H58-5 | USA | JN673054 | JN673027 |
** A, Carol Shearer, ascomycetes; AF, Astrid Ferrer; ASM, Andrew S. Methven; ANM, Andrew N. Miller; CS, Carol Shearer hyphomycetes (mitosporic fungi); CBS, Centraalbureau voor Schimmelcultures; CH, China; E, Astrid Ferrer hyphomycetes; EB, Eric Boehm ascomycetes; F, Florida, freshwater ascomycetes; GSMNP, Great Smoky Mountain National Park; H, Huzefa Raja, hyphomycetes; MP, Meike Piepenbring; MYA, American Type Culture Collection; R, Huzefa Raja, ascomycetes; SMH, Sabine M. Huhndorf; JF, Jack Fournier; VPH, Vince P. Hustad.
Total genomic DNA from terrestrial ascomycetes was extracted using methods outlined in
Each sequence fragment was subjected to an individual BLAST search to verify its identity. MCM7
sequences from the GenBank were assembled and aligned with newly
obtained sequences using Sequencher 4.9 (Gene Codes Corp.), optimized
by eye, and manually corrected. For the LSU data, the newly obtained
sequences were aligned with sequences from GenBank using the multiple
sequence alignment program, MUSCLE® (
Maximum likelihood (ML) and Bayesian Inference (BI) methods were used in phylogenetic analyses for both the MCM7 and LSU datasets. The Akaike Information Criterion (AIC) (
The individual LSU and MCM7 datasets were examined for potential conflict before they were combined into a single dataset for total evidence analyses (
All of the 89 sequences from the MCM7
alignment were used to assess transitions/transversions (ti/tv)
substitution saturation of first, second, and third-codon positions.
Observed ti/tv was plotted against Jukes Cantor JC89 corrected distance (
We performed a phylogenetic informativeness (PI) measure on our combined dataset as proposed by
A total of 89 taxa were included in the study, which comprises 80 species belonging to 63 genera of lichenized and non-lichenized ascomycetes in the classes Dothideomycetes, Eurotiomycetes, Geoglossomycetes, Lecanoromycetes, Leotiomycetes, and Sordariomycetes (Table 1).
New taxa sequencedWe report 93 new sequences of which 65 are MCM7 and 28 are LSU (Table 1). Table 1
provides accession numbers for sequences used from GenBank in addition
to those newly generated in this study. Most of the newly generated data
for both MCM7 and LSU are from ascomycetes that occur as saprobes on wood in terrestrial (
Both LSU and MCM7 alignments consisted of the same 89-taxon dataset. The original LSU dataset had a total of 1484 nucleotides. After aligning in MUSCLE and excluding nucleotides from the 5´ and 3´ ends due to missing data in most sequences, the LSU dataset consisted of 1141 nucleotides. The final LSU dataset after excluding 57 ambiguous characters and two short intron regions from Saccharomyces cerevisiae consisted of 1076 nucleotides. The LSU dataset had 551 constant characters, 123 variable characters, and 402 parsimony informative characters (Table 2). The MCM7 dataset consisted of a total of 642 nucleotides (193 constant, 449 variable); there were no missing characters, ambiguous regions, or introns. The majority of informative characters were in third codon positions (Table 2). The GC content of MCM7 was slightly higher than LSU, although nucleotide percentages were somewhat similar in both datasets (Table 2). Although MCM7 had fewer nucleotides analyzed, it had a higher percent (62%) of parsimony informative characters than LSU (37%) (Table 2). The final LSU and MCM7 combined dataset had 1718 nucleotides.
Comparison of datasets and trees in phylogenetic analyses.
| Datasets | Genes | ||
|---|---|---|---|
| LSU (28S nrDNA) (DNA) | MCM7 (MS456)(DNA) | CombinedLSU and MCM7 | |
| No. of taxa | 89 | 89 | 89 |
| No. of primers used to sequence region | 4 | 2 | 4 + 2 |
| No. of total charactersa | 1141 | 642 | 1783 |
| No. of ambiguous characters | 57 | None | - |
| No. of characters in introns | 8 | None | - |
| No. of characters analysed | 1076(range 889–1064) | 642(range 641-642) | 1718(range 1531-1706) |
| No. of constant characters | 551 | 193 | 744 |
| No. of parsimony informative charactersb | 402(37%) | 108, 79, 212 (399) (62%) | 801(47%) |
| No. of variable parsimony uninformative characters | 123(11%) | 50(8%) | 173(11%) |
| %GC | 50.852 | 51.493 | 51.096 |
| %A | 25.914 | 25.345 | 25.697 |
| %C | 21.525 | 24.967 | 23.601 |
| %G | 29.327 | 24.526 | 27.495 |
| %T | 23.233 | 23.162 | 23.207 |
| (-ln)L score using PhyML | 14971 | 24325 | 39965 |
| No. of clades with ≥ 70% bootstrap support in PhyML analyses with 1000 bootstrap replicates | 46 | 38 | 62 |
| No. of clades with ≥ 70% bootstrap support in RAxML analyses with 1000 bootstrap replicates | 52 | 39 | 63 |
| No. of clades with ≥ 95% Bayesian posterior probability | 62 | 46 | 61 |
a Excluding sites at 5’ and 3’ ends
b Divided into first, second, and third codon positions for MCM7; total shown in parentheses
The estimated model parameter values obtained from AIC with modeltest are listed in Table 3. Application of separate models on the different codon positions for MCM7 did not affect the topology and posterior probabilities of clades (data not shown). Since PhyML and BI analyses produced trees with nearly identical topologies, only PhyML phylograms are shown (Figs 1–3).
Maximum likelihood best-fit evolutionary models and parameters for separate and combined data sets selected by Akaike Information Criterion.
| Datasets | Genes | |||
|---|---|---|---|---|
| LSU(28S nrDNA)(DNA) | MCM7 (MS456)(DNA) | CombinedLSU and MCM7 | MCM7(1-2 codon positions) | |
| Number of sites | 1076 | 642 | 1718 | 428 |
| Model | GTR + I + Ga | GTR + I + G | GTR+ I + G | GTR+ I + G |
| -L (ln) | 15101 | 24434 | 40100 | 7407 |
| Base frequencies | ||||
| A | 0.2601 | 0.2462 | 0.2444 | 0.3359 |
| C | 0.2234 | 0.2798 | 0.2598 | 0.2314 |
| G | 0.2929 | 0.2288 | 0.2620 | 0.2187 |
| T | 0.2236 | 0.2452 | 0.2337 | 0.2140 |
| Substitution model rate matrix | ||||
| [A–C] | 0.7196 | 3.8836 | 1.6263 | 3.3571 |
| [A–G] | 1.8621 | 11.6510 | 4.4131 | 4.4215 |
| [A–T] | 1.1078 | 2.9992 | 1.6638 | 2.3969 |
| [C–G] | 0.7829 | 2.4761 | 1.1231 | 1.5438 |
| [C–T] | 5.0397 | 13.6071 | 6.9837 | 5.9435 |
| [G–T] | 1.0000 | 1.0000 | 1.0000 | 1.0000 |
| Among site variation | ||||
| Ib | 0.3527 | 0.2723 | 0.3754 | 0.3490 |
| Gc | 0.5727 | 0.6444 | 0.5916 | 0.7948 |
a General Time Reversible model (
b Proportion of invariable sitescVariable sites gamma distribution parameter
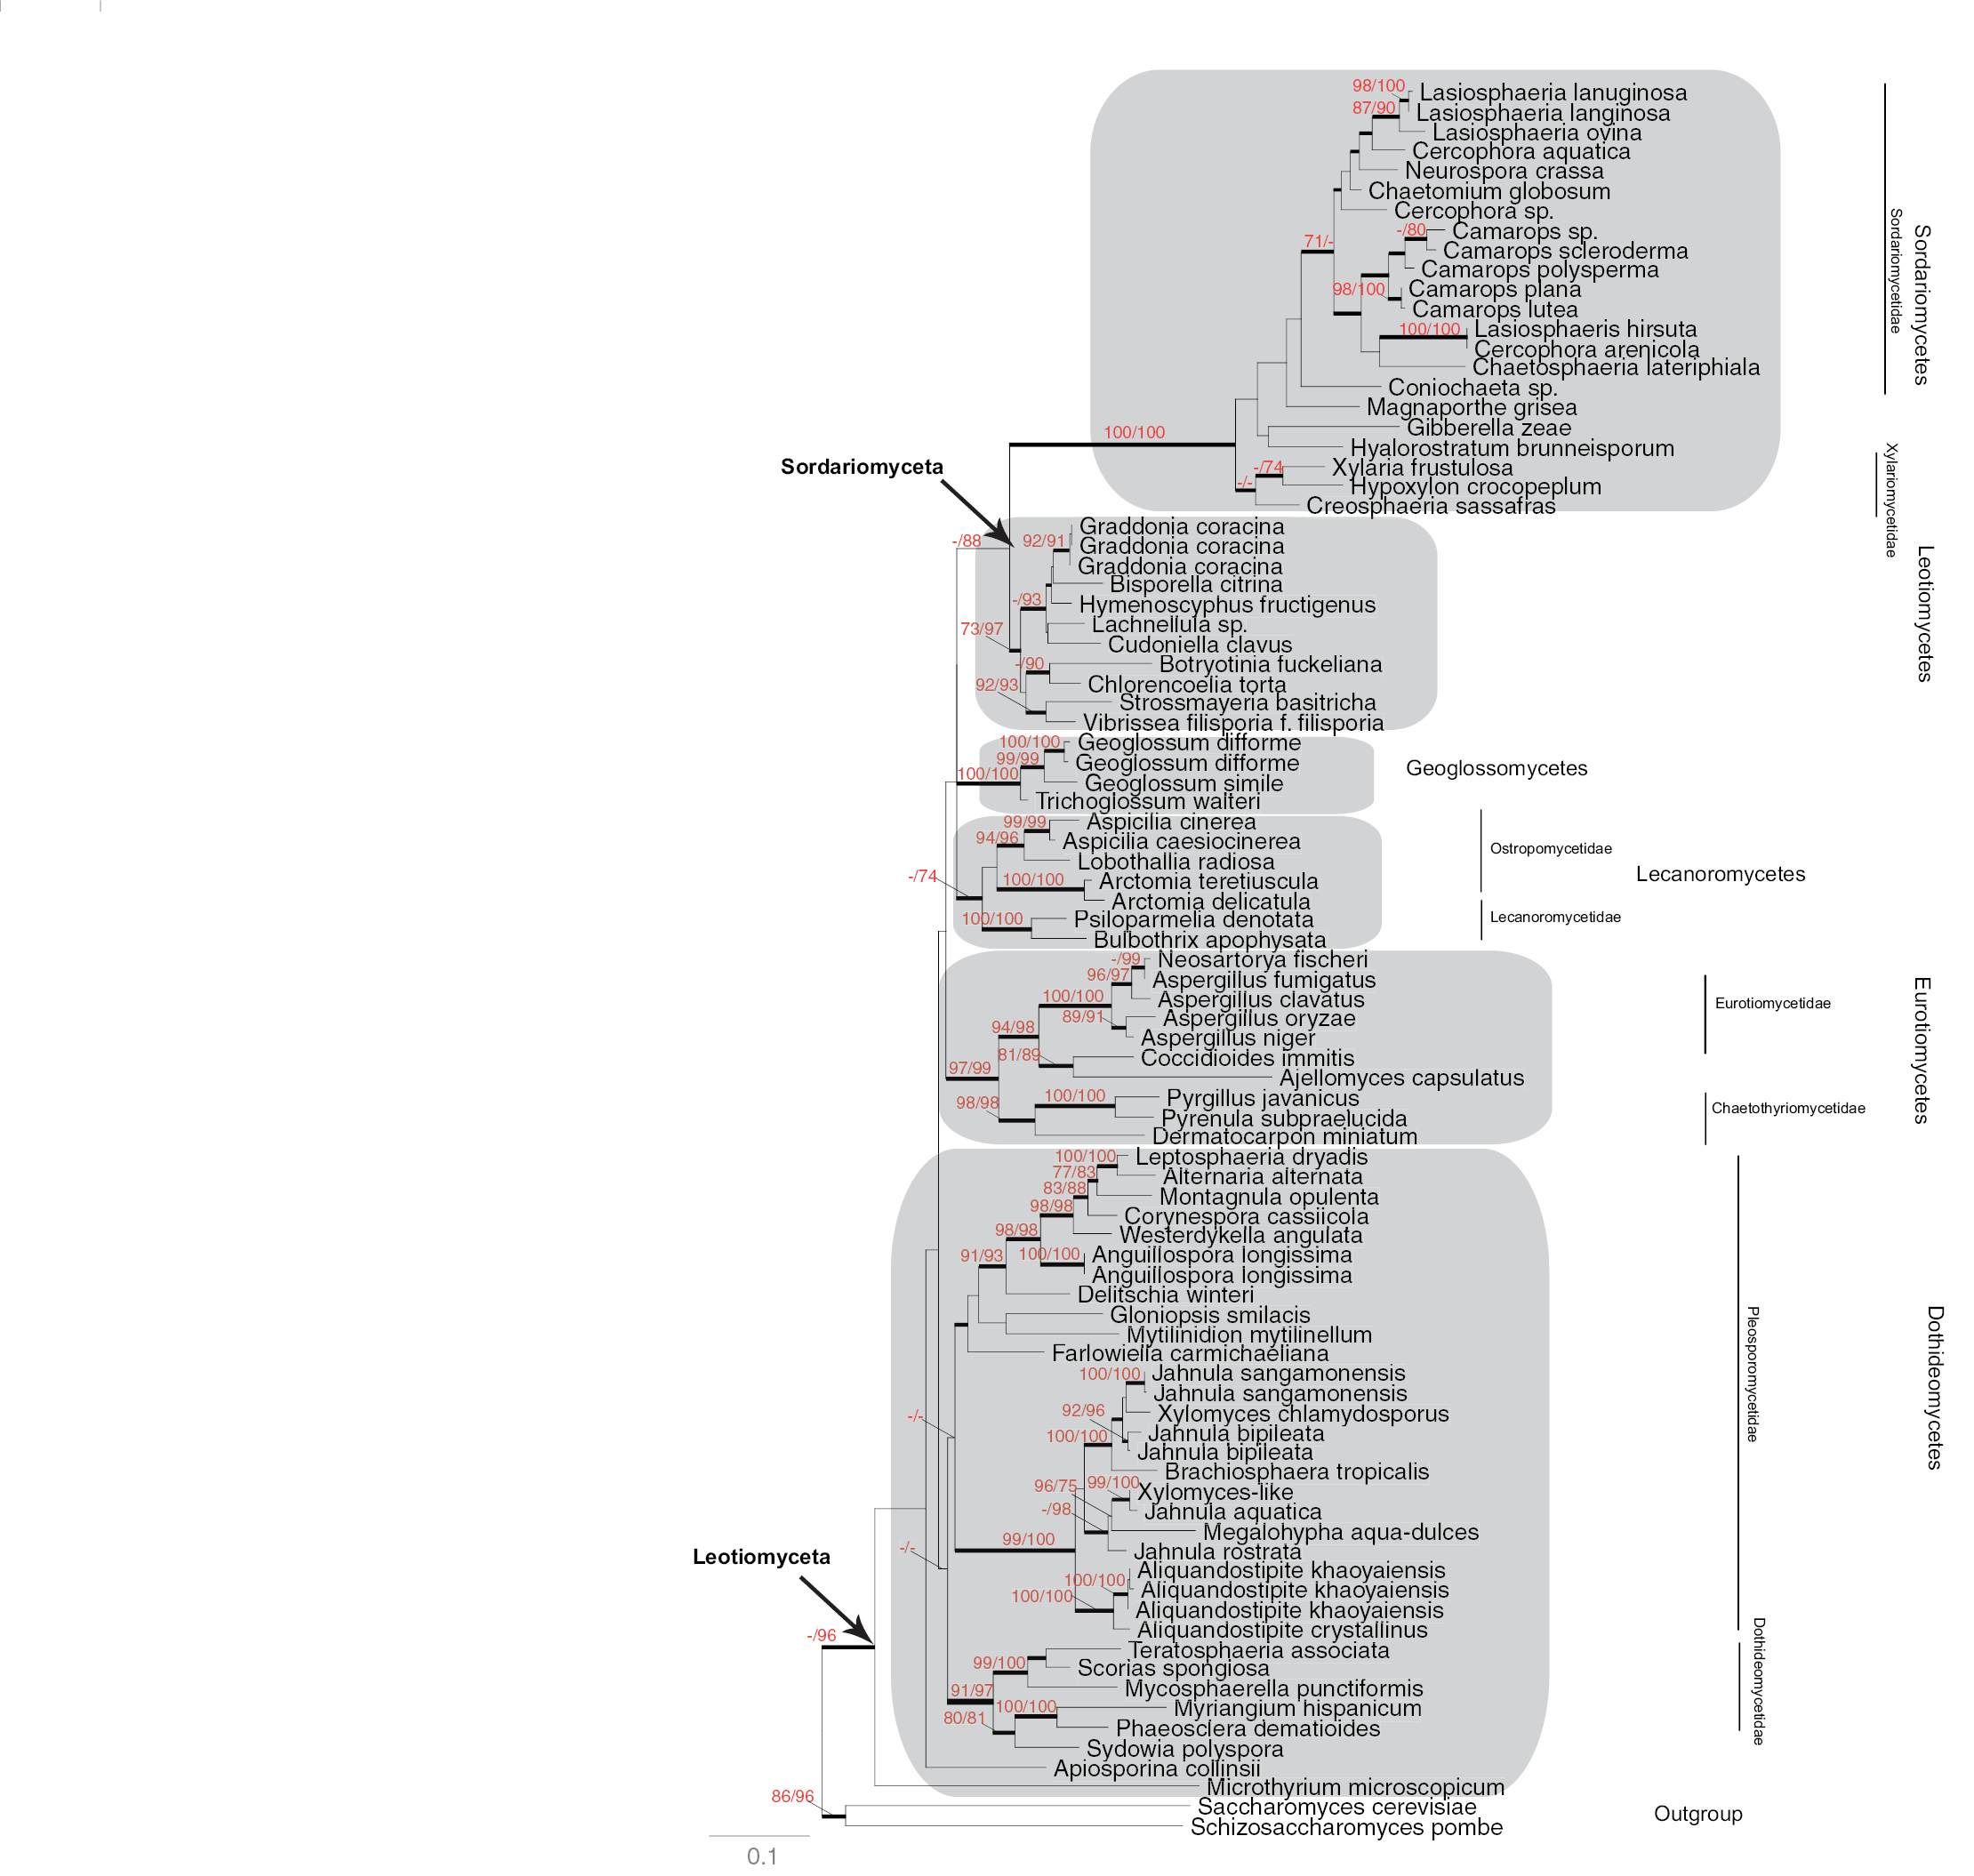
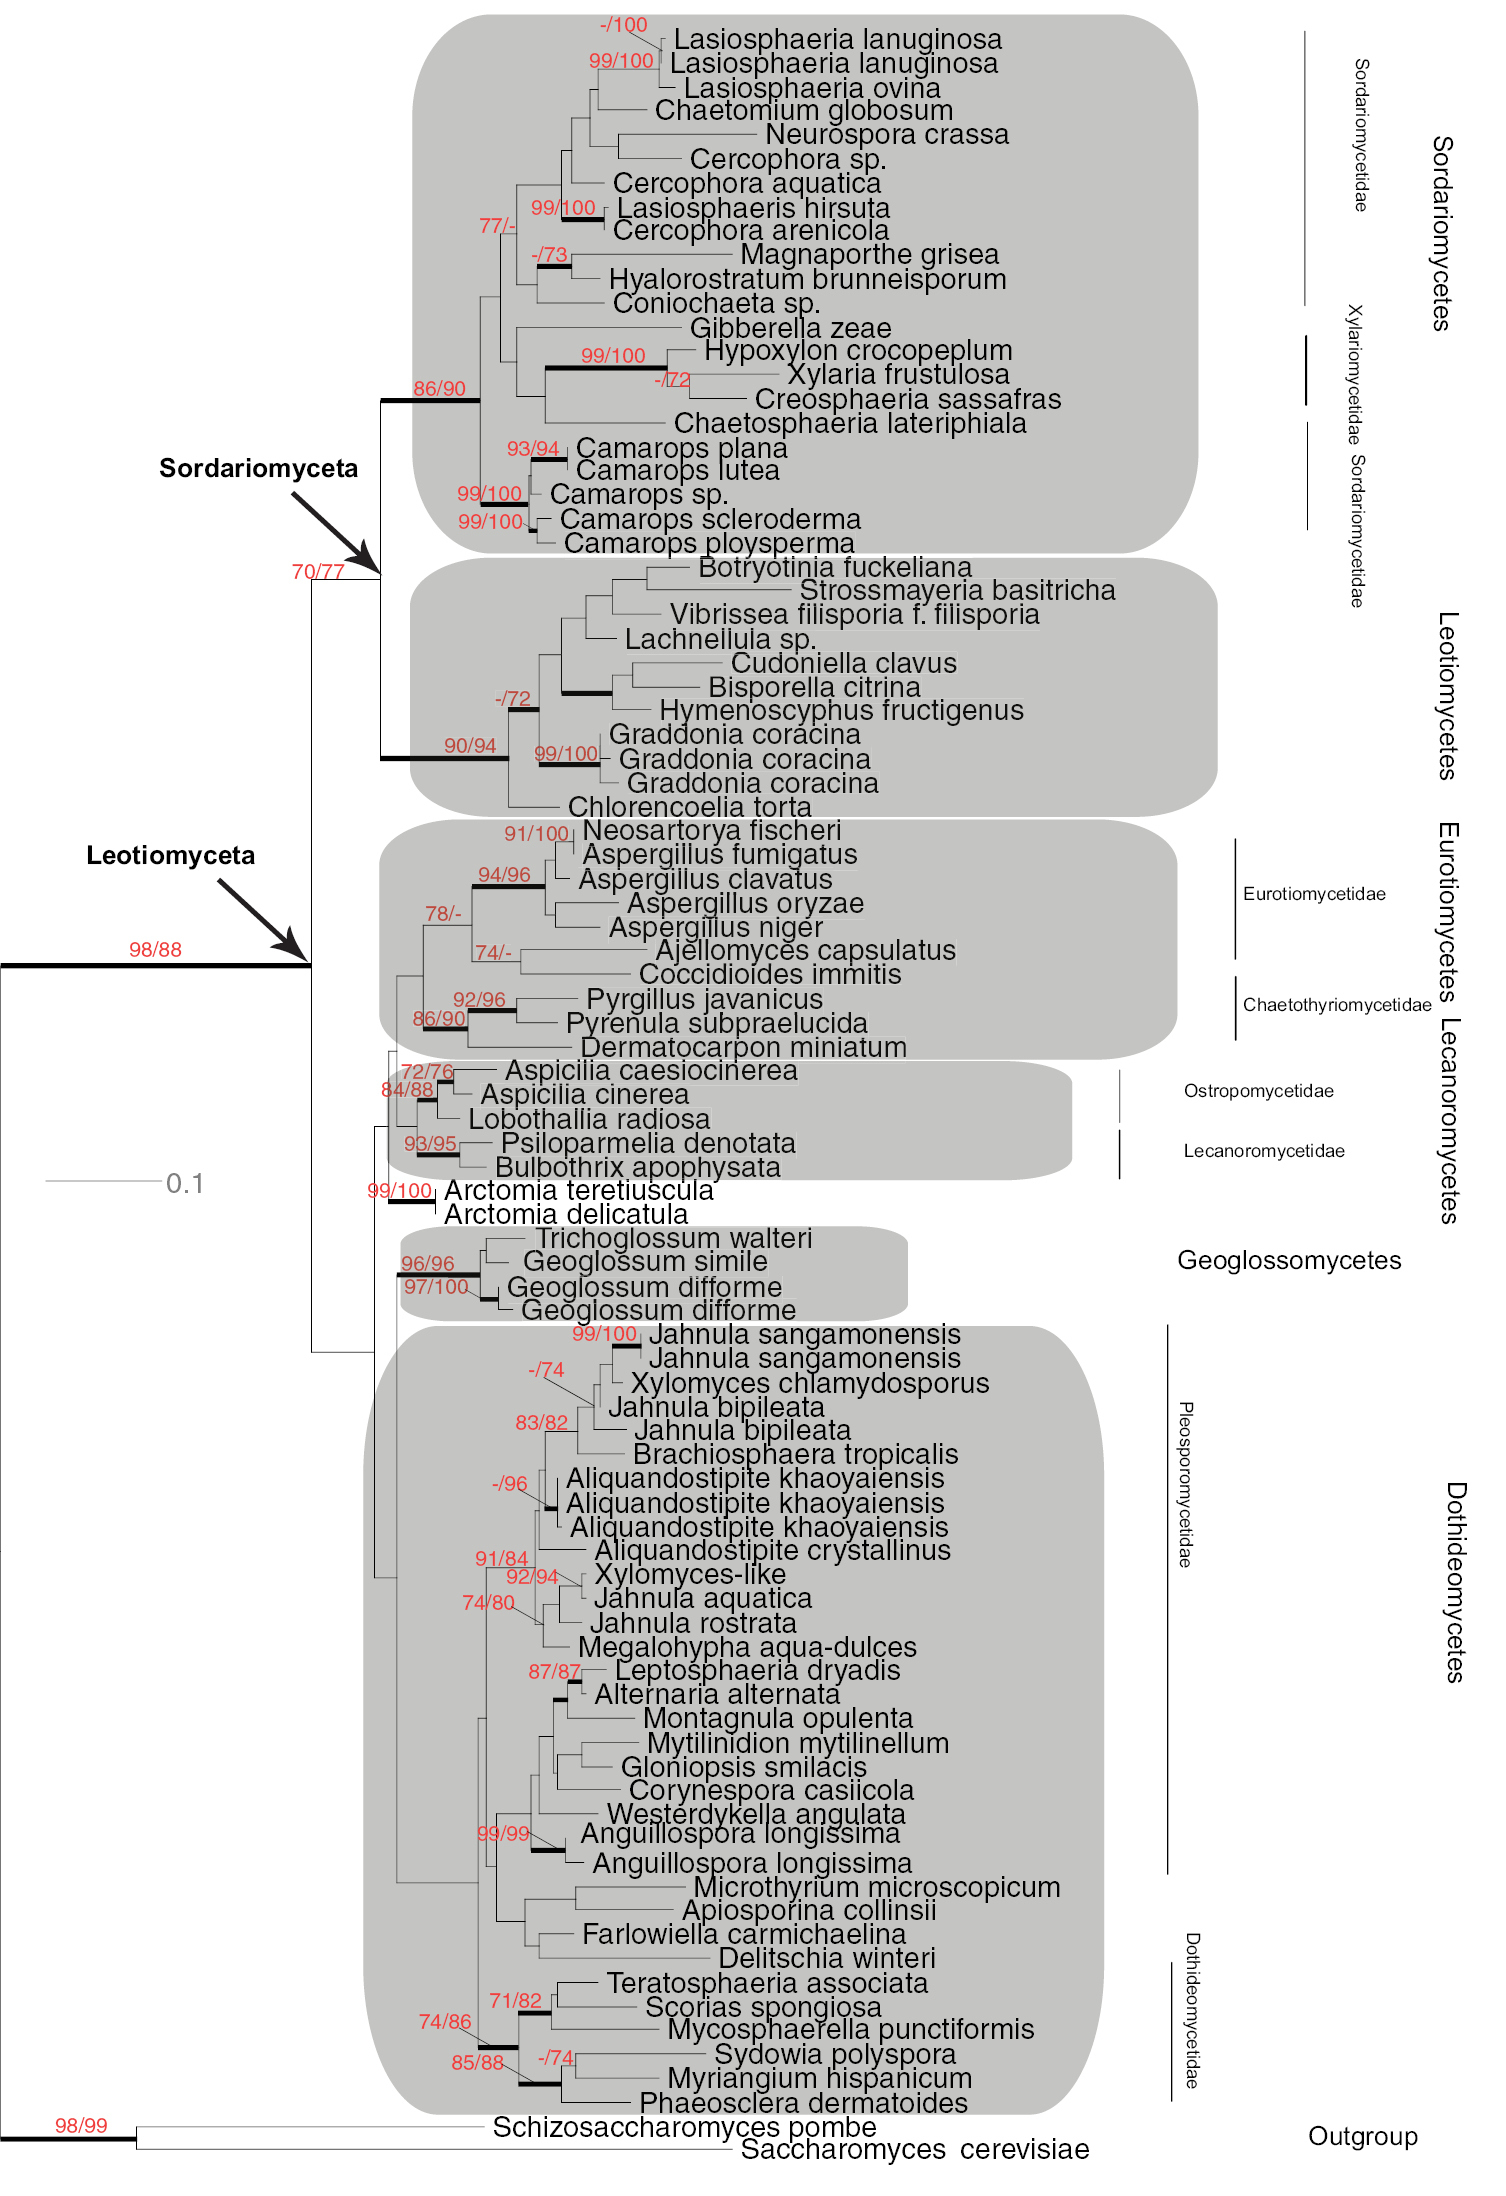
Maximum Likelihood phylogeny of Leotiomyceta (Ascomycota)
based on 28S nrDNA large subunit data set (1141 bp) of 89 taxa using
PhyML ((-ln)L score 14971) . Thickened branches indicate significant
Bayesian posterior probabilities ≥ 95%; numbers refer to PhyML/RAxML
bootstrap support values ≥ 70% based on 1000 replicates. One
representative each from Saccharomycotina and Taphrinomycotina was used as outgroup taxa. The major classes are shaded in grey. Classification following
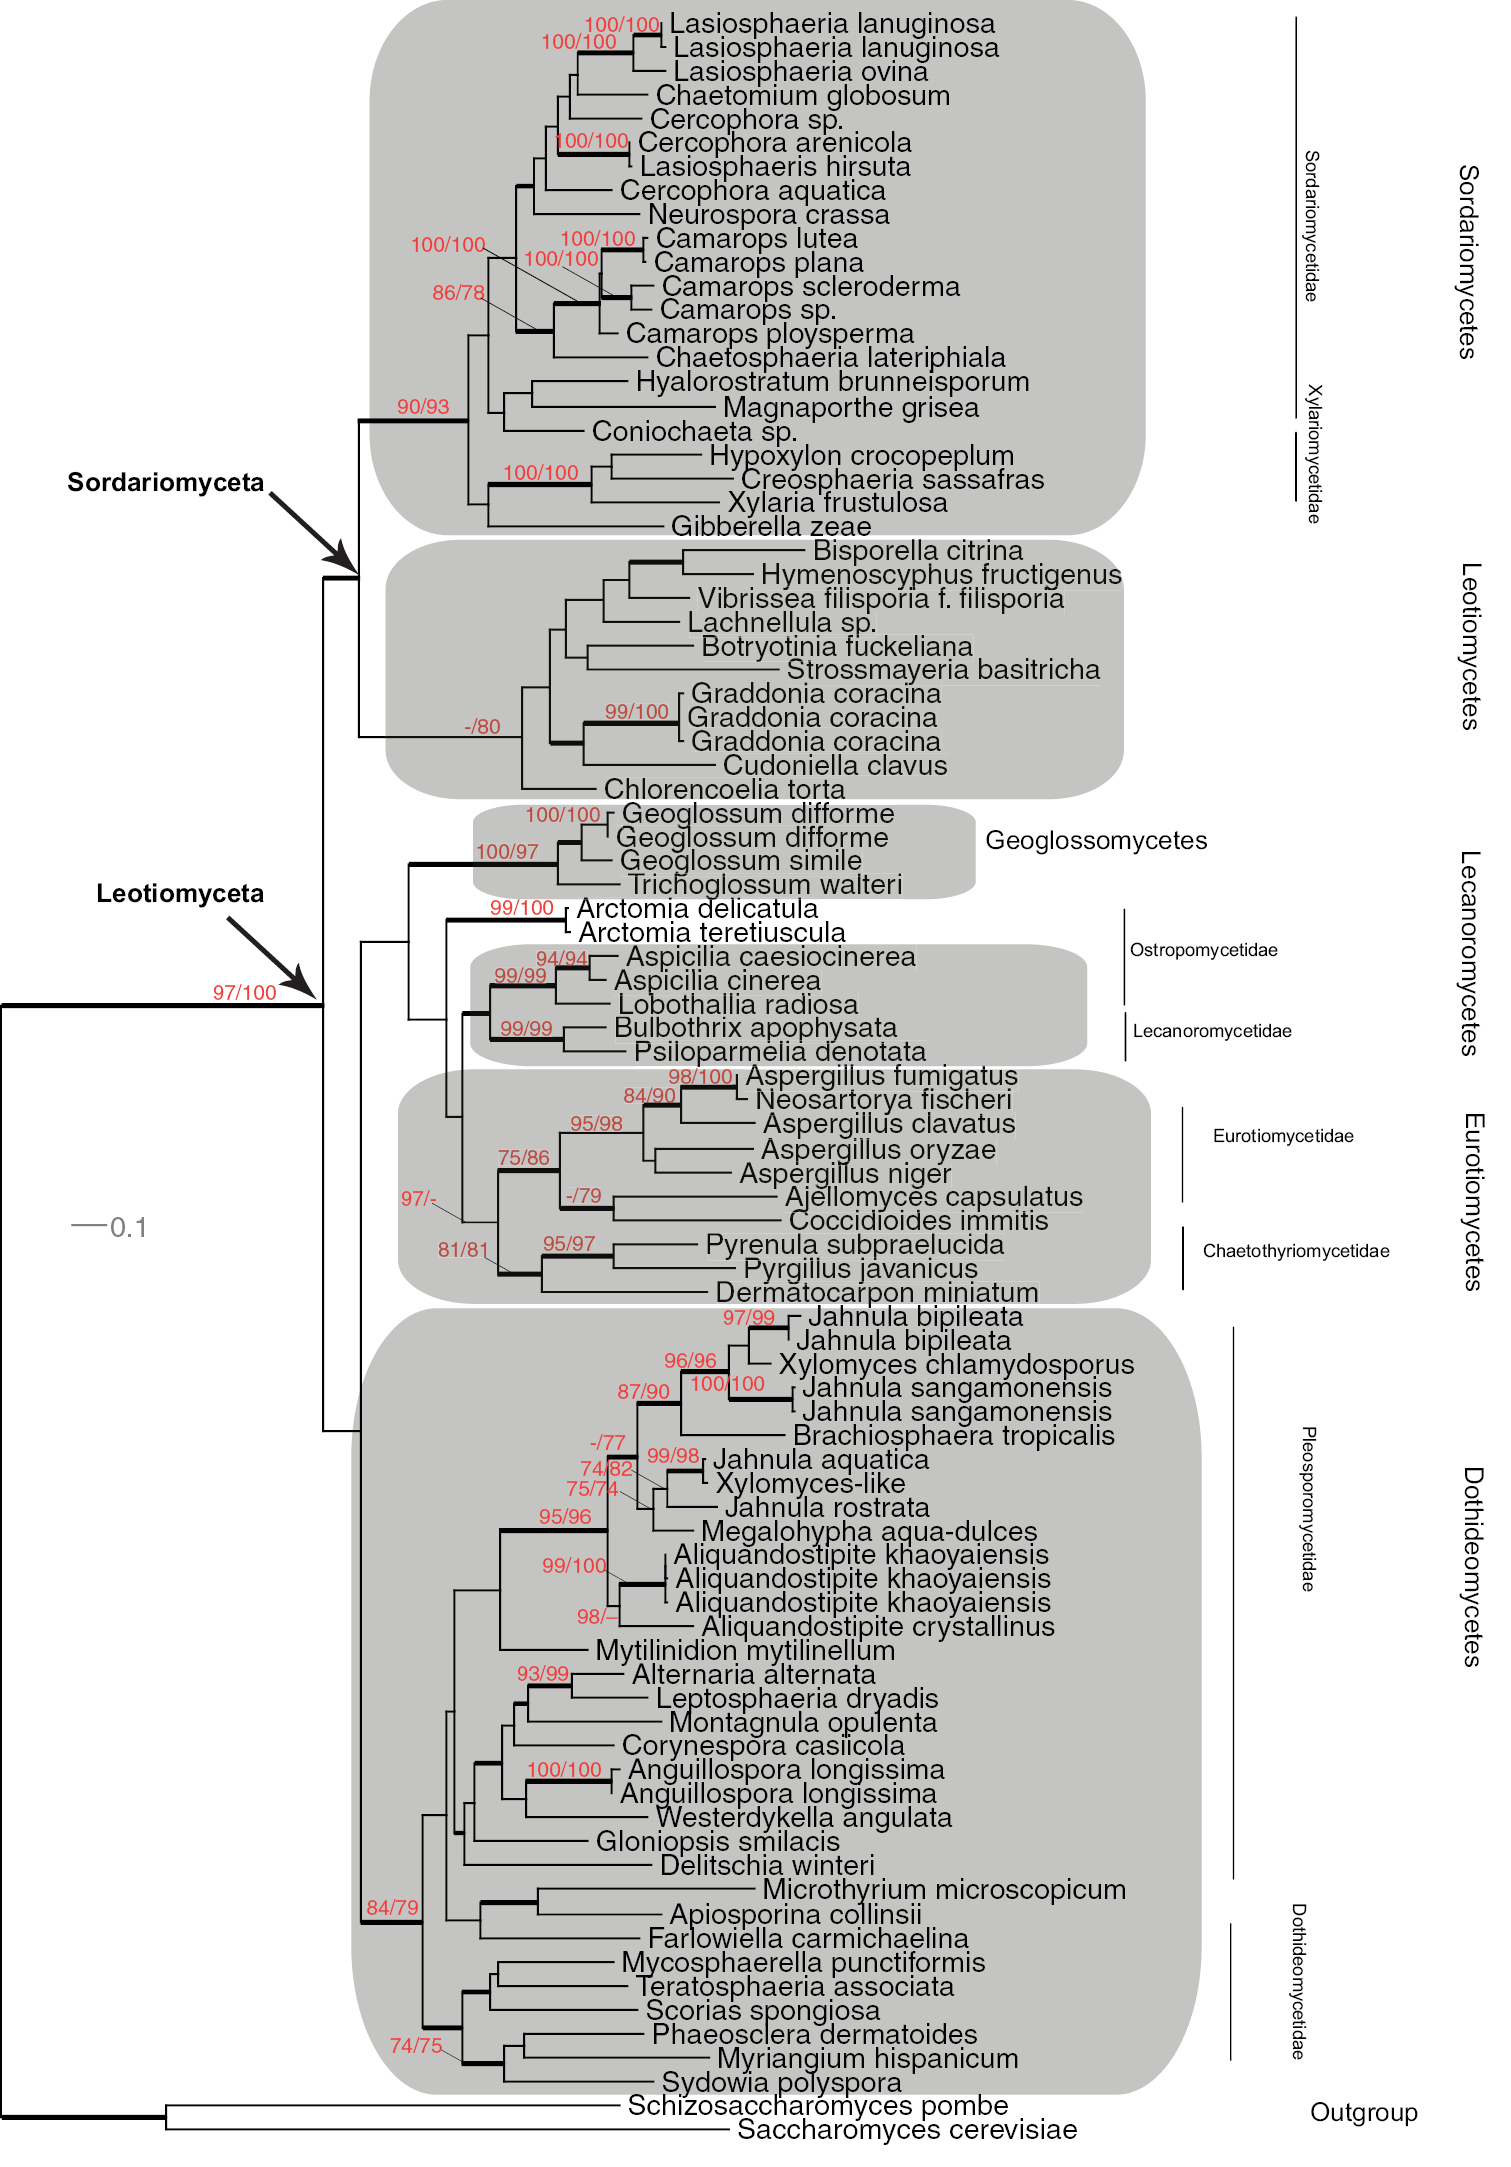
Maximum Likelihood phylogeny of Leotiomyceta (Ascomycota) based on MCM7 data set (642 bp) of 89 taxa using PhyML ((-ln)L score 24325). Support values, shading and classification as in Fig. 1.
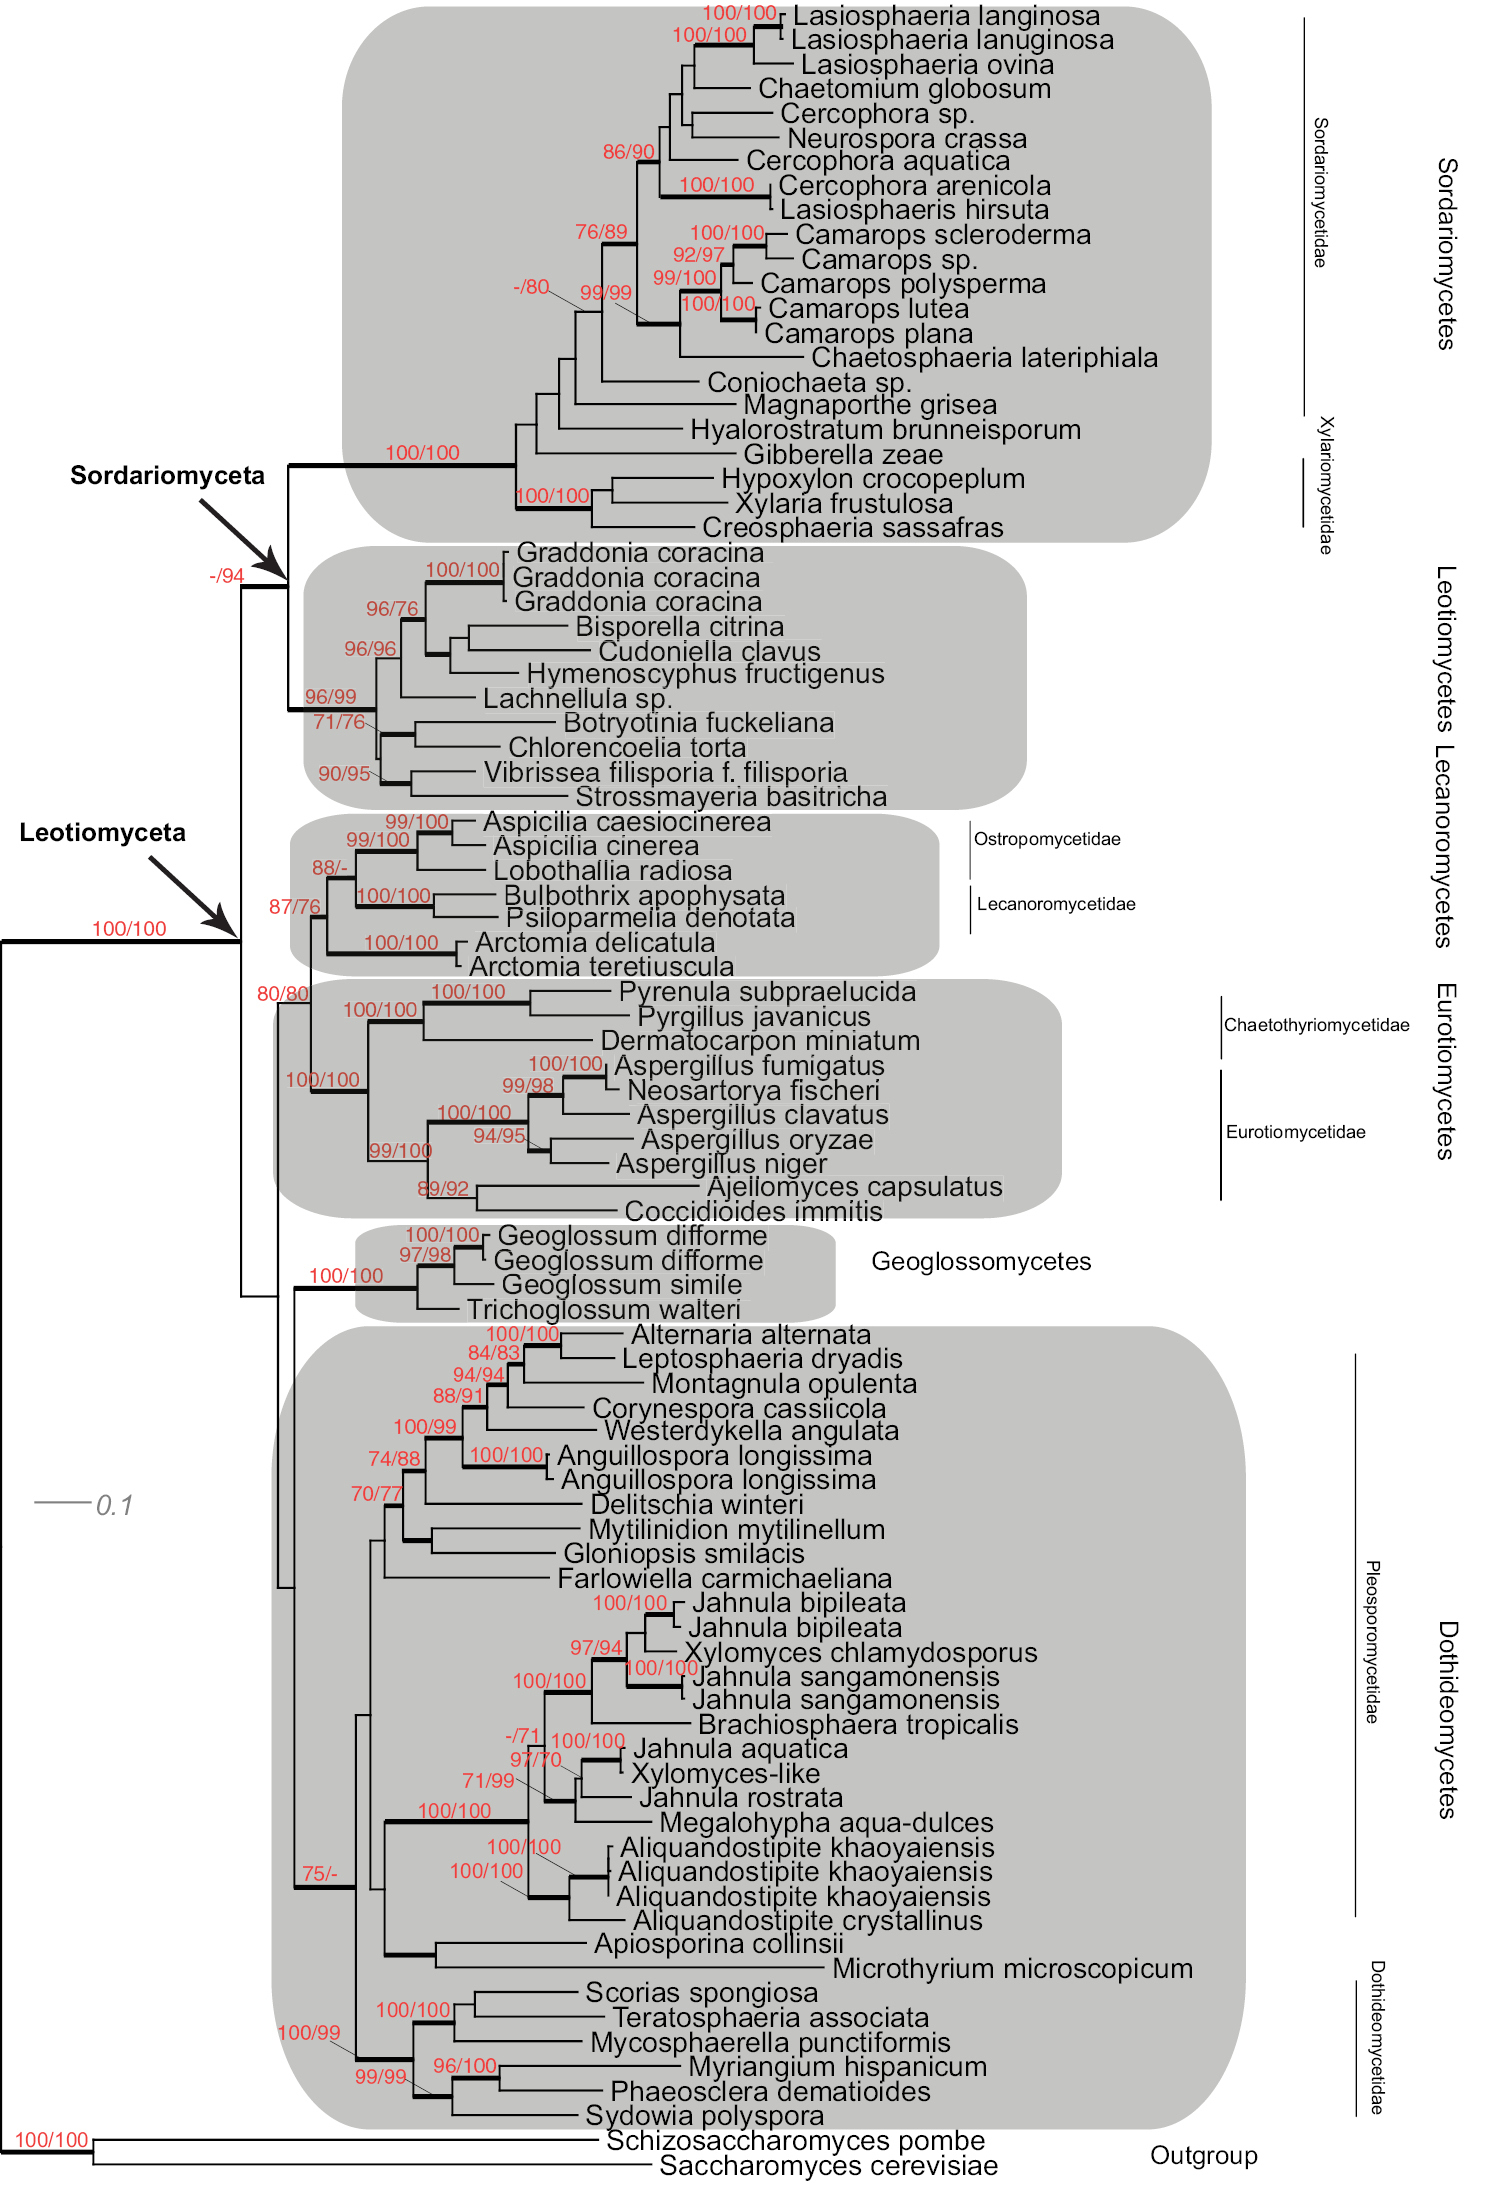
Maximum Likelihood phylogeny of Leotiomyceta (Ascomycota) based on a combined 28S nrDNA large subunit and MCM7 data set (1718 bp) of 89 taxa using PhyML ((-ln)L score 39965). Support values, shading and classification as in Fig. 1.
Class-level relationships: The overall tree topologies of LSU and MCM7 genes were identical with the represented classes of fungi occurring as monophyletic (Figs 1 and 2). A total of 46 clades received strong support (≥ 70% BS and ≥ 95% BPP) with PhyBS, 52 for RAxBS, and 62 for BPP for LSU, whereas, 38, 39, and 46 clades were strongly supported for PhyBS, RAxBS, and BPP, respectively, for MCM7 (Table 2).
More major lineages within the Ascomycota were more strongly supported with LSU compared to MCM7
data. For LSU, nine nodes were strongly supported with PhyBS and ten
with RAxBS, while twelve were strongly supported with BPP (Table 4). For MCM7, ten nodes were strongly supported with PhyBS and RAxBS, while only nine were strongly supported based on BPP (Table 4). The somewhat higher support for the LSU gene may be due to the greater sequence length for LSU when compared to MCM7 in the present study.
Comparision of PhyML bootstrap support (PhyBS), RAxML bootstrap support (RAxBS), and Bayesian posterior probabilities (BPP) of all lineages within the Leotiomyceta (Ascomycota) included in the present study obtained from separate and combined data partitions of LSU rDNA and MCM7 sequence data. Only values > 70% BS, and > 95% BPP are shown.
| Lineages | LSU rDNA | MCM7 (1, 2, 3 codon positions) | LSU_MCM7 (1, 2, 3 codon positions) | MCM7 (1, 2 codon positions) | ||||||||
|---|---|---|---|---|---|---|---|---|---|---|---|---|
| PhyBS | RAxBS | BPP | PhyBS | RAxBS | BPP | PhyBS | RAxBS | BPP | PhyBS | RAxBS | BPP | |
| Sordariomycetes 1 | 100 | 100 | > 95 | 90 | 98 | > 95 | 100 | 100 | > 95 | 86 | 90 | > 95 |
| Sordariomycetidae 2 | – | – | – | – | – | – | – | – | – | – | – | – |
| Xylariomycetidae | – | – | > 95 | 100 | 100 | > 95 | 100 | 100 | > 95 | 99 | 100 | > 95 |
| Leotiomycetes | 73 | 97 | > 95 | – | 80 | – | 96 | 99 | > 95 | 90 | 94 | > 95 |
| Geoglossomycetes | 100 | 100 | > 95 | 100 | 97 | > 95 | 100 | 100 | > 95 | 96 | 96 | 100 |
| Lecanoromycetes | – | 74 | > 95 | – | – | – | 87 | 76 | > 95 | – | – | – |
| Ostropomycetidae | 94 | 96 | > 95 | 99 | 99 | > 95 | 99 | 100 | > 95 | 84 | 88 | > 95 |
| Lecanoromycetidae | 100 | 100 | > 95 | 99 | 99 | > 95 | 100 | 100 | > 95 | 93 | 95 | > 95 |
| Eurotiomycetes | 97 | 99 | > 95 | 97 | – | – | 100 | 100 | > 95 | – | – | – |
| Eurotiomycetidae | 94 | 98 | > 95 | 75 | 86 | > 95 | 99 | 100 | – | 94 | 96 | > 95 |
| Chaetothyriomycetidae | 98 | 98 | > 95 | 81 | 81 | > 95 | 100 | 100 | > 95 | 86 | 90 | > 95 |
| Dothideomycetes | – | – | – | 84 | 79 | > 95 | 75 | – | > 95 | – | – | – |
| Pleosporomycetidae | – | – | > 95 | – | – | – | 70a | 77 | > 95 | – | – | – |
| Dothideomycetidae | 91 | 97 | > 95 | 74 | 75 | > 95 | 100 | 99 | > 95 | 74 | 86 | > 95 |
| Total class lineages supported | 4 | 5 | 5 | 4 | 4 | 3 | 6 | 5 | 6 | 3 | 3 | 3 |
| Total subclass lineages supported | 5 | 5 | 7 | 6 | 6 | 6 | 7 | 7 | 6 | 6 | 6 | 6 |
| Total nodes supported | 9 | 10 | 12 | 10 | 10 | 9 | 13 | 12 | 12 | 9 | 9 | 9 |
a excluding Farlowiella carmichaeliana
1 Class lineages are given in bold
2 Subclass lineages are given in italics
Genus level relationships among selected genera used in the present study. Support values and analyses are same as in Table 4.
| Lineages | LSU rDNA | MCM7 (1, 2, 3 codon positions) | LSU_MCM7 (1, 2, 3 codon positions) | MCM7 (1, 2 codon positions) | ||||||||
|---|---|---|---|---|---|---|---|---|---|---|---|---|
| PhyBS | RAxBS | BPP | PhyBS | RAxBS | BPP | PhyBS | RAxBS | BPP | PhyBS | RAxBS | BPP | |
| Sordariomycetes | ||||||||||||
| Camarops | – | – | > 95 | 100 | 100 | > 95 | 99 | 100 | > 95 | 99 | 100 | > 95 |
| Lasiosphaeria | 87 | 90 | > 95 | 100 | 100 | > 95 | 100 | 100 | > 95 | 99 | 100 | – |
| Leotiomycetes | ||||||||||||
| Graddonia | 92 | 91 | > 95 | 99 | 100 | > 95 | 100 | 100 | > 95 | 99 | 100 | > 95 |
| Eurotiomycetes | ||||||||||||
| Aspergillus | 100 | 100 | > 95 | 95 | 98 | – | 100 | 100 | > 95 | 94 | 96 | > 95 |
| Dothideomycetes | ||||||||||||
| Aliquandostipite | 100 | 100 | > 95 | 98 | – | – | 100 | 100 | > 95 | – | – | – |
| Total nodes supported | 4 | 4 | 5 | 5 | 4 | 3 | 5 | 5 | 5 | 4 | 4 | 3 |
Genus and species level relationships: Within the Dothideomycetes, Eurotiomycetes, Geoglossomycetes, and Sordariomycetes, we selected more than one species/strain within a genus to assess the performance of MCM7 (MS456) versus LSU. Our data shows that MCM7 can be used for assessing interspecific relationships of taxa within genera such as Camarops, Lasiosphaeria, (Sordariomycetes), Aspergillius (Eurotiomycetes), Geoglossum (Geoglossomycetes), and Aliquandostipite (Dothideomycetes). The above taxa sampled from their different classes within the Leotiomyceta each formed a monophyletic clade with high internal resolution and support based on MLBS and BPP values in each gene tree (see Figs 1 and 2, and Table 5). However, the combined gene tree showed even better resolution of relationships and clade support for the above genera (Fig. 3, Table 5). Removing the third codon position had a slight negative effect on clade support within genera (Fig. 5, Table 5).
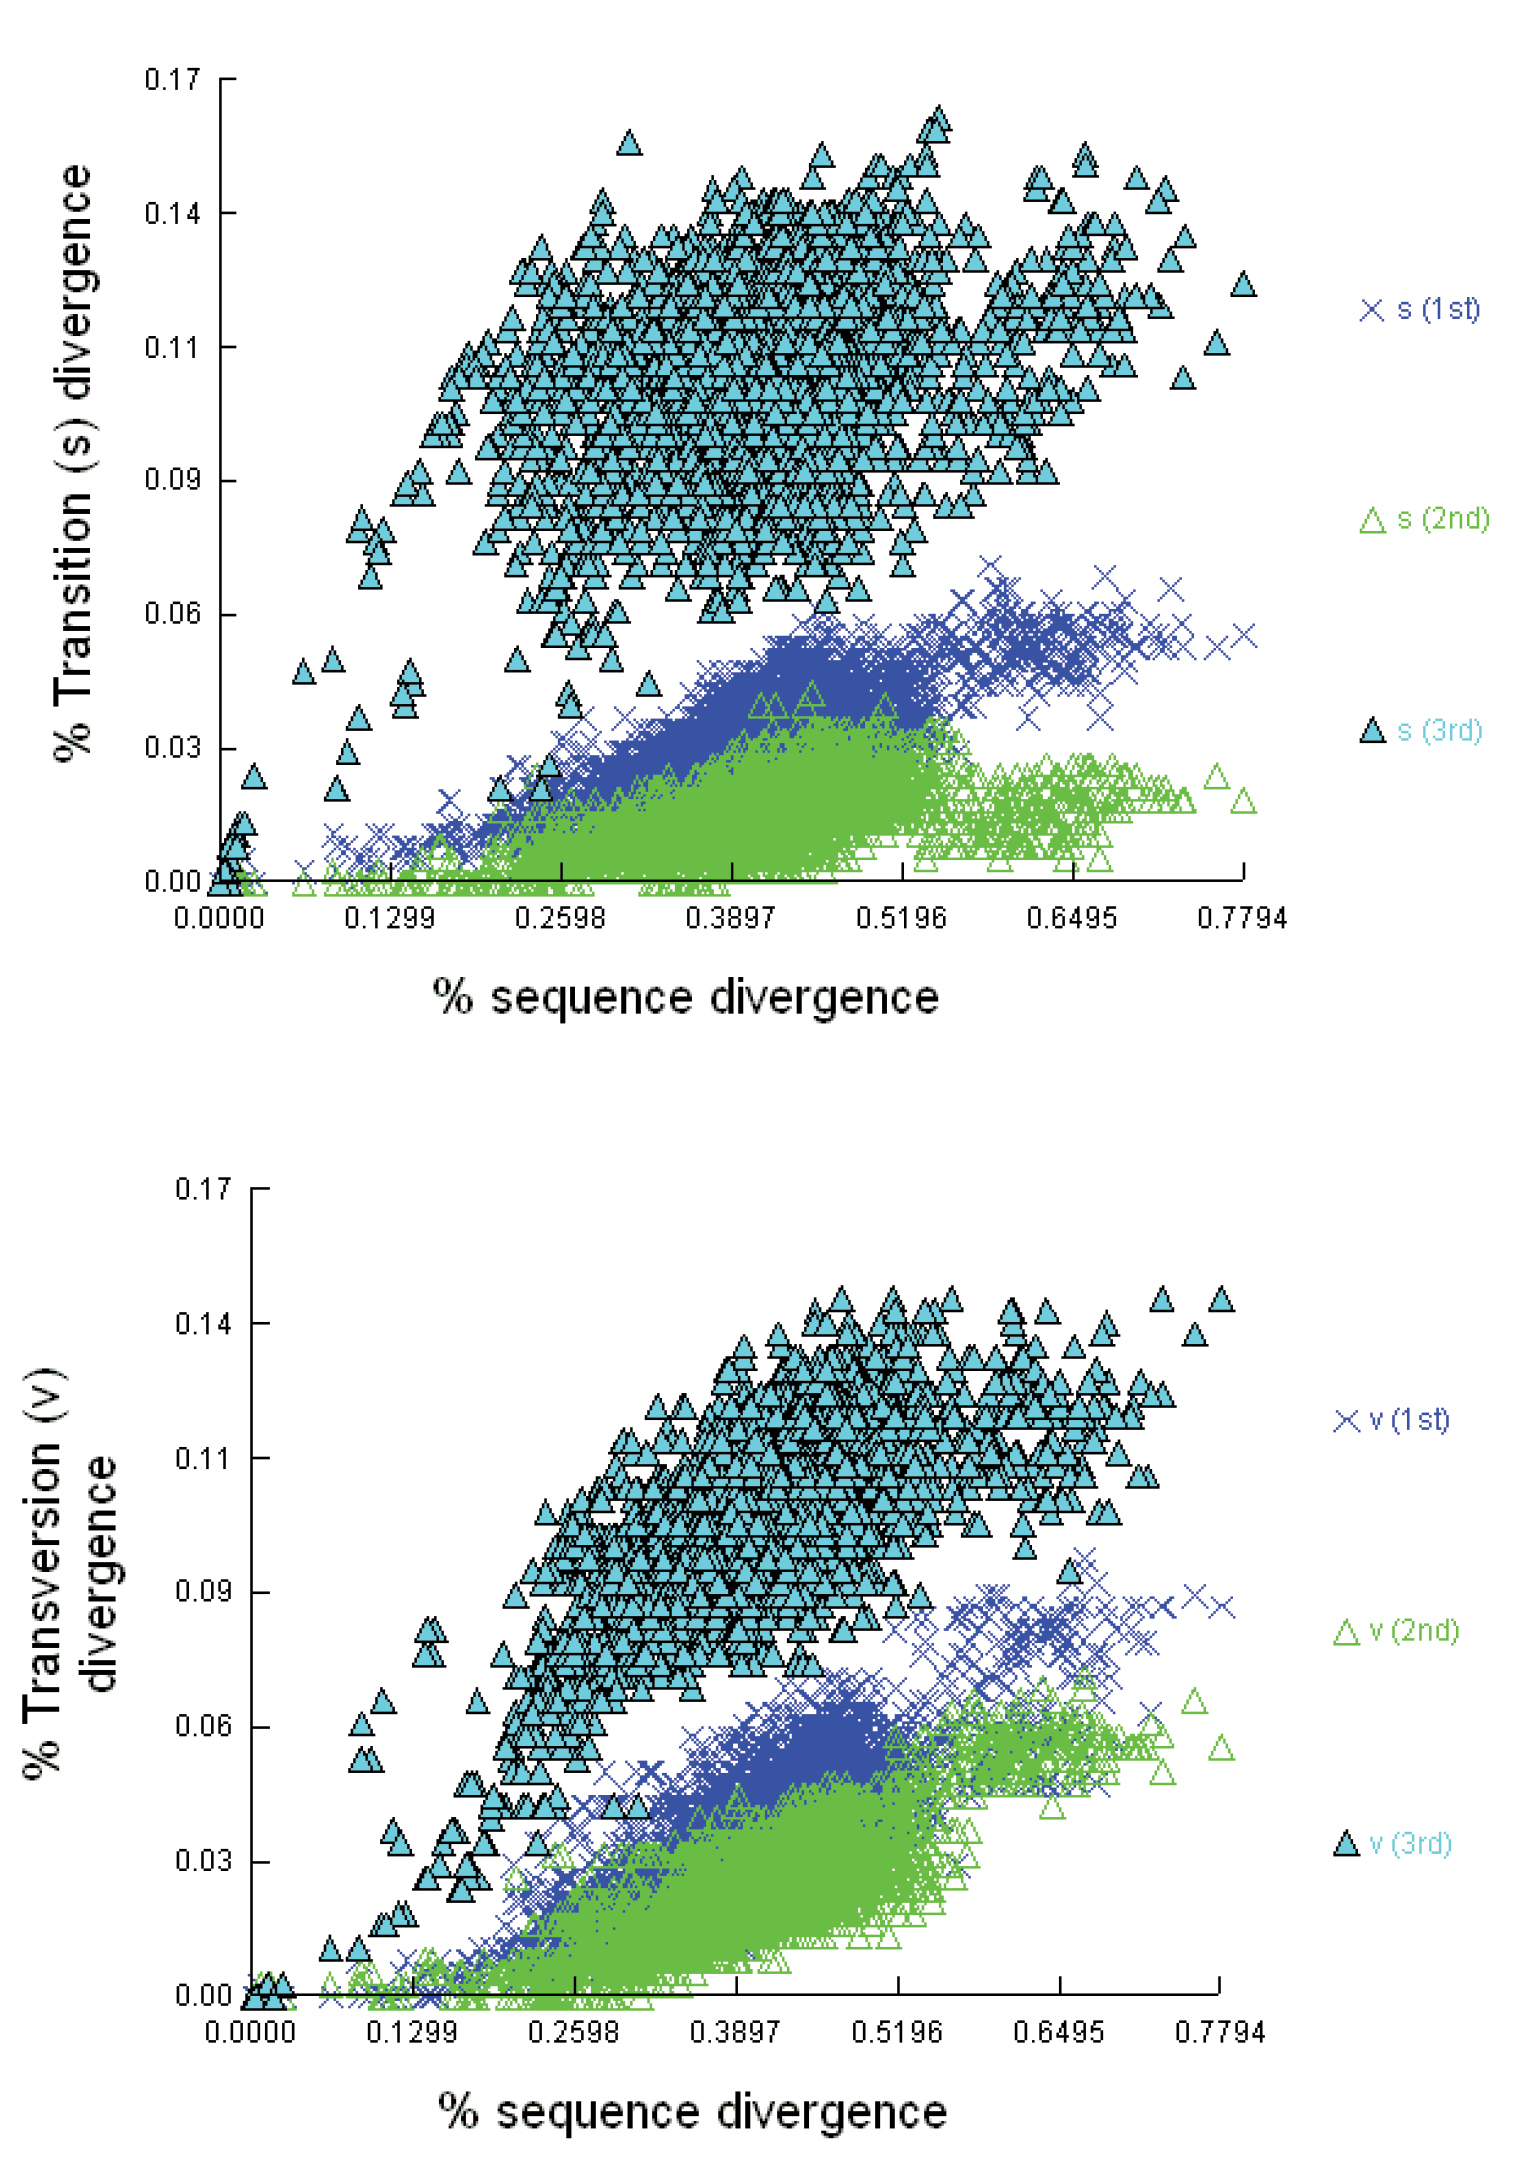
Nucleotide substitution saturation plots: The proportion of transitions (s) and transversions (v) were plotted against sequence divergence using Jukes-Cantor evolutionary distance in the program DAMBE.
Maximum Likelihood phylogeny of Leotiomyceta (Ascomycota) based on 1-2 codon position of MCM7 data set (428 bp) of 89 taxa using PhyML ((-ln)L score 7352). Support values, shading and classification as in Fig. 1.
Since no significant conflict occurred among well-supported clades in each tree topology, we concatenated the two gene regions. The combined LSU-MCM7 gene tree (Fig. 3) had a total of 801 parsimony informative characters (Table 2) and provided a more robust phylogenetic hypothesis of the Ascomycota (Fig. 3) than either individual tree topology. A total of 62 clades were strongly supported with PhyBS, 63 with RAxBS, and 61 with BPP (Table 2). The combined tree also received higher nodal support for the major lineages included with 13 strongly supported lineages with PhyBS, twelve with RAxBS, and twelve with BPP (Table 4). The nodal support for the combined data set was higher for the total number of strongly supported clades as well as for the number of nodes strongly supported for the major lineages in comparison to the separate gene analyses (see Table 3, 4 and Figs 1–3). A number of nodes that were moderately (< 70 % BS and < 95% BPP) or poorly (< 50 % BS and < 70% BPP) supported in the separate gene analyses received strong support in the combined gene analyses (Table 4).
Substitution saturationThere is no indication of substitution saturation in the first or second codon positions (Fig. 4).
However, for the third codon position, it is evident that there is
leveling off in the scatter plot when transition/transversion divergence
are plotted against pairwise sequence divergence (Fig. 4).
It is also clear that third codon position transitions reach a plateau.
Saturation tests therefore indicate poor phylogenetic signal at the
third codon position, and transitions appear to be saturated on a plot
of substitution type against JC corrected genetic distances. The test of
The PhyML tree resulting from an analysis of only first and second codon positions for MCM7 is presented in Fig. 5. The topology of this phylogenetic tree is not congruent with the LSU and MCM7 trees or the combined gene trees. One major difference was that the Xylariomycetidae clade nested within the Sordariomycetidae clade. In addition the nodal support for the major lineages was quite poor for the first and second codon position tree when compared to the separate LSU and MCM7 gene trees or the combined gene tree (Table 4). For example, Dothideomycetes and Eurotiomycetes did not receive support with PhyBS, RAxBS, or BPP (Table 4). However, the MCM7 gene tree with all codon positions included showed strong support for the Dothideomycetes and the Eurotiomycetes lineage was strongly supported with PhyBS (Table 4).
Phylogenetic InformativenessWe derived the profiles from rates of evolution of sites within genes using PhyDesign, an online platform for profiling PI (
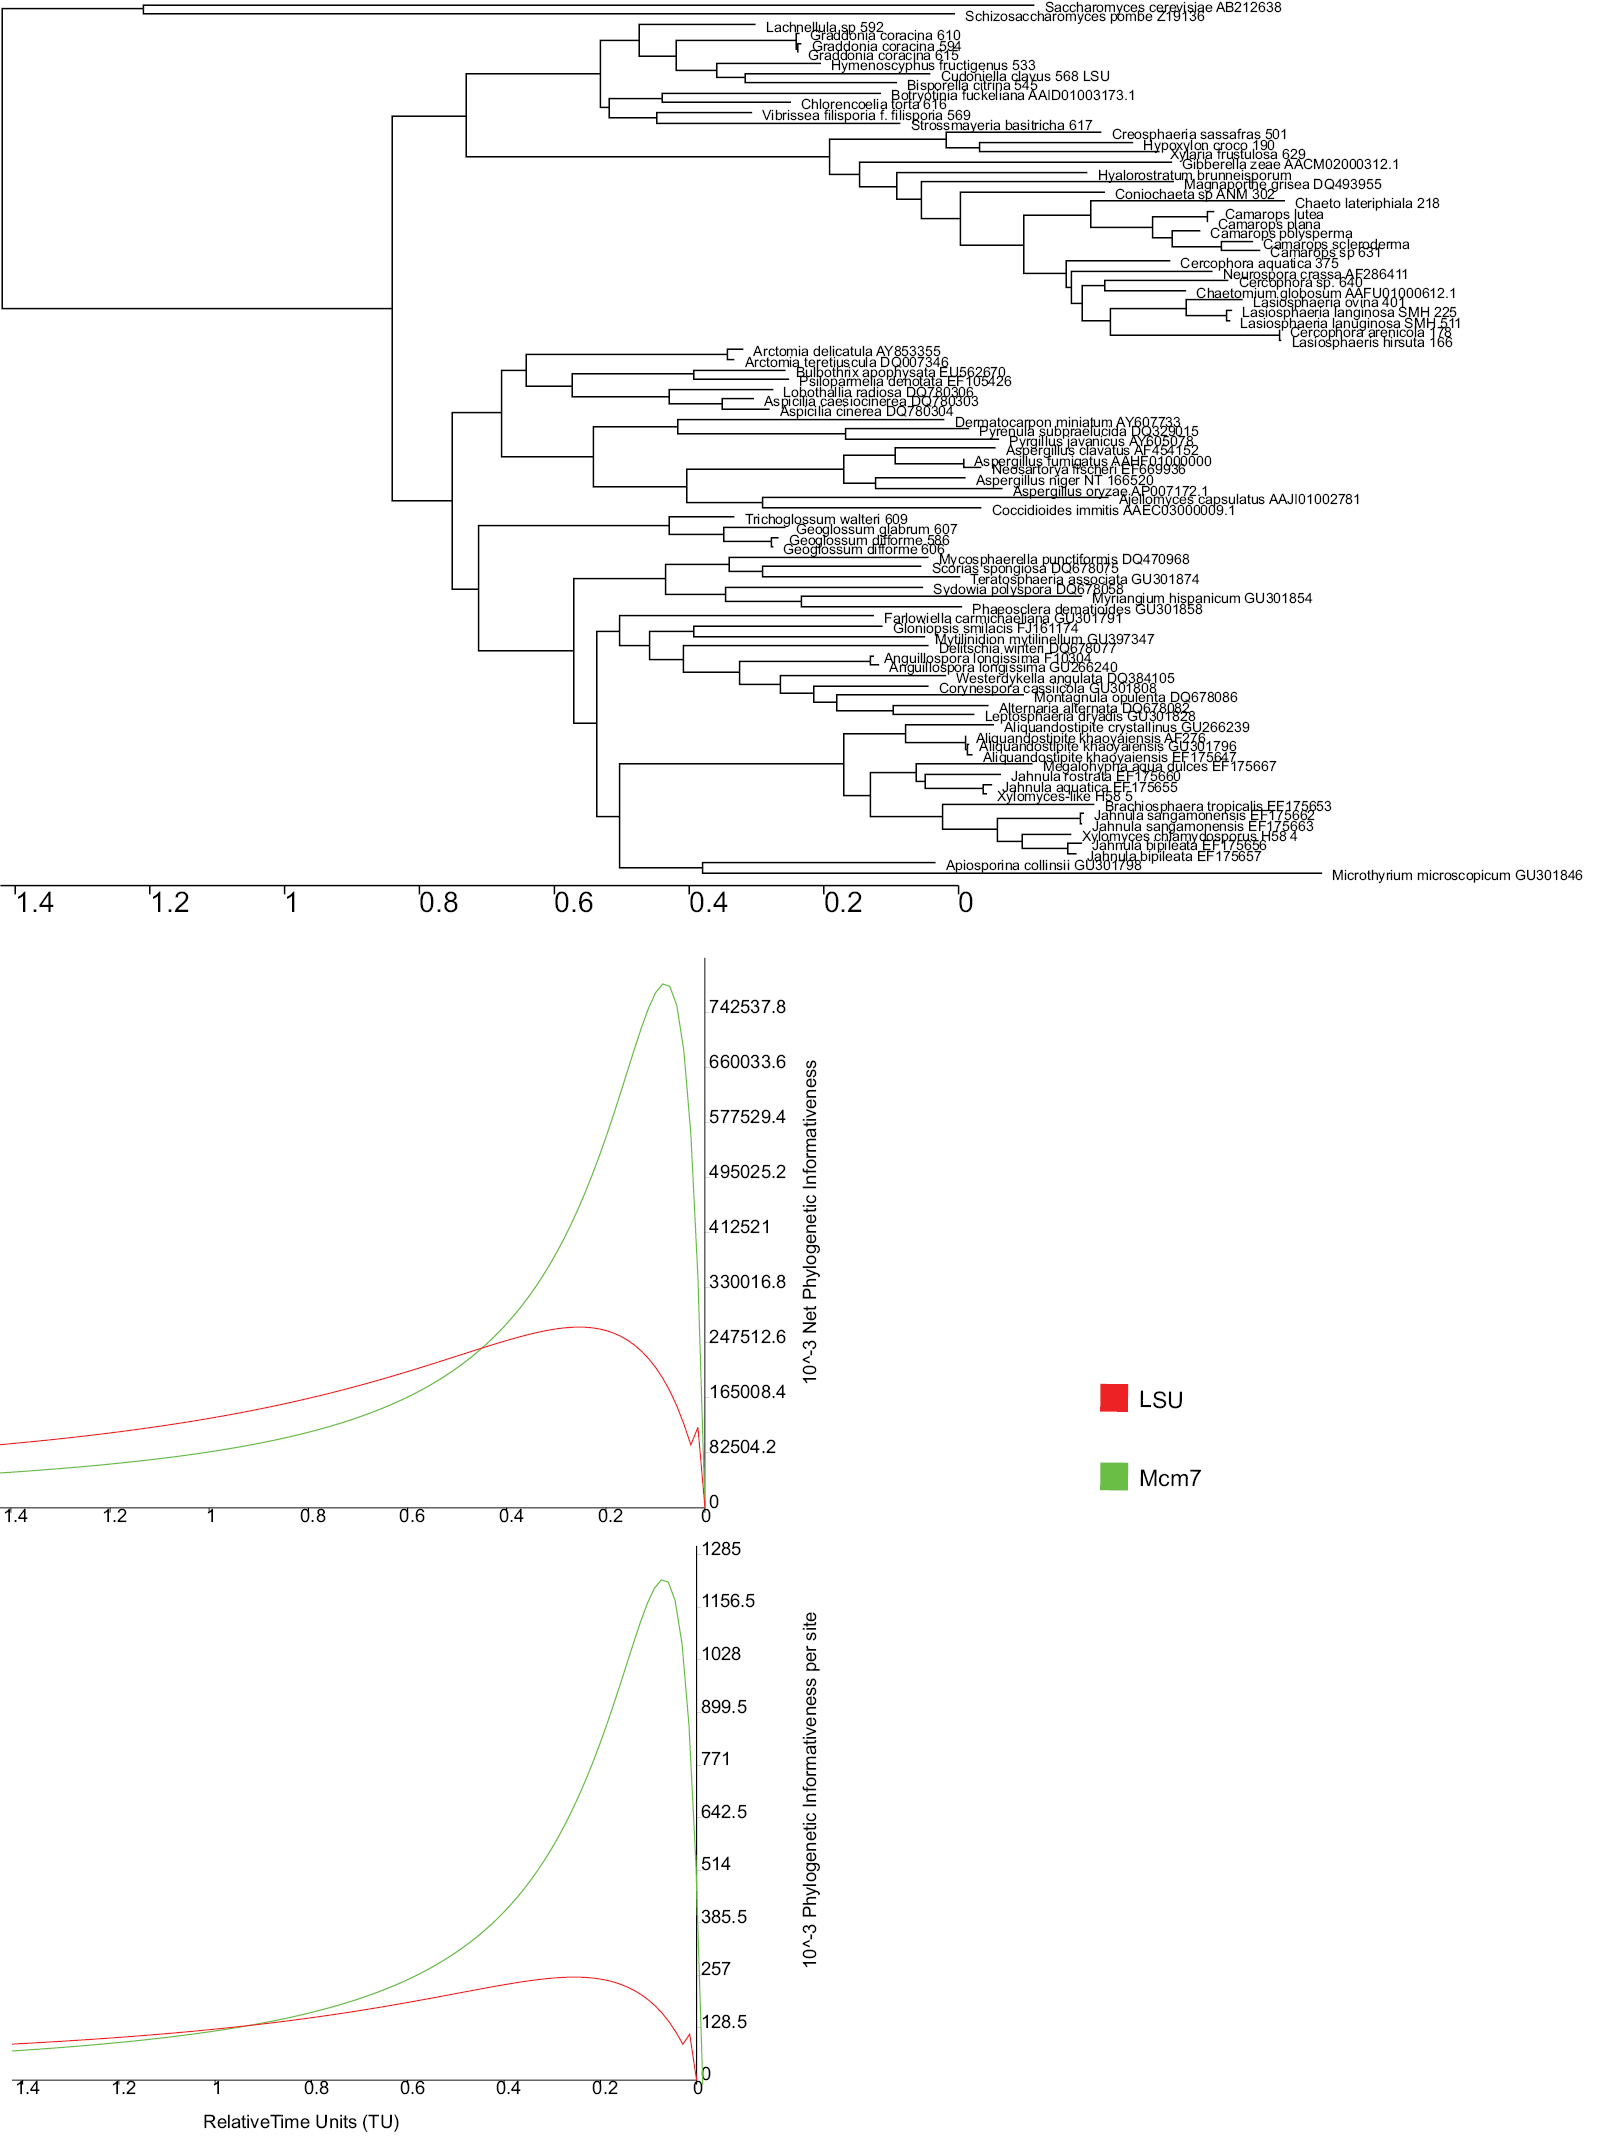
Phylogenetic informativeness profiles for two genes LSU (1076 bp) and MCM7 (642 bp) through 1.4 time units using PhyDesign online tool. Tree was obtained with PHYML. The relative time units are shown on the X-axis and profiles of net and per-site phylogenetic informativeness is shown on the Y-axis. Profiles of LSU gene are shown in red and MCM7 are shown in green.
The topologies of the major classes obtained using the LSU gene (Fig. 1) as well as the MCM7 gene (Fig. 2) broadly agrees with previously published multi-gene phylogenies of Ascomycota (
We included more than one species or isolate of various genera such as Camarops, Lasiosphaeria (Sordariomycetes), Graddonia (Leotiomycetes), Aspergillus (Eurotiomycetes), and Aliquandostipite (Dothideomycetes) to test how MCM7 would perform in resolving relationships at the genus-level. Although several species of Jahnula
were included in our study, we do not discuss results for this genus
in more detail since independent data strongly suggest the genus may be
polyphyletic within the order Jahnulales (
Combining datasets generally provides better
resolution and nodal support for clades in phylogenetic analyses of the
fungal kingdom (
In this study the third codon position in MCM7 appears to be saturated based on scatter plots of substitution saturation curves (Fig. 4), which agrees with results of empirical tests by
Based on our analyses of the MCM7 dataset with and without third codon positions (Fig. 2, all codon positions included, and Fig. 5,
third codon positions excluded), we found that exclusion of third
codon positions did not have a major effect on the monophyly of the
classes, except that the subclass Xylariomycetidae was nested within the Sordariomycetidae when third codon positions were excluded (Fig. 5).
However, exclusion of third codon positions led to a loss of nodal
support (MLBS and BPP) for several clades both at the class and genus
level (Table 4, 5). These results are in agreement with those found by
We have presented evidence for the phylogenetic utility of MCM7 among the Ascomycota. Results of the PI profiles show that MCM7
was more informative than LSU. Here we show that this locus can also be
used successfully for determining phylogenetic relationships of
non-lichenized ascomycetes and provides good resolution and support at
half the cost compared to LSU because we used only two primers to
sequence the MCM7 gene as opposed to four primers used routinely for LSU. In addition, no introns were present in the MCM7 gene for the taxa sequenced in our study. MCM7
seems to qualitatively contribute to better resolution of higher as
well as lower taxonomic level clades. We also show that combined LSU and
MCM7 gene phylogeny had superior resolving power for both class
and genus level relationships since all major classes received high BS
in both PhyML and RAxML bootstrap analyses as well as high BPP values.
We report that although the third codon position of MCM7 is
saturated, it may be better to analyze the dataset with all codon
positions included. Exclusion of third codon positions compromised the
overall topology of the tree and, in some clades, resulted in poor
nodal support with MLBS and BPP, perhaps due to exclusion of a
significant number of phylogenetically informative characters.
MCM7 shows good potential to be a candidate gene for fungal phylogeny reconstruction, especially for the Ascomycota. However, future studies comparing MCM7 with RPB1, RPB2, and EF1 alpha are warranted for the Ascomycota to better understand which single copy protein coding locus is easiest to PCR amplify and sequence, while at the same time also provides the greatest amount of phylogenetic informativeness.
This work was supported by the National Science Foundation Grant (NSF) DEB-08-44722 to CAS and ANM and in part by a NSF Grant DEB-05-1558 to ANM. CLS was also supported in part by the Intramural Research program of the National Institutes of Health, National Library of Medicine. We would also like to thank Astrid Ferrer, Jack Rogers and Sabine M. Huhndorf for providing some of the taxa and/or cultures used in this study. Any opinions, findings and conclusions or recommendations expressed in this publication are those of the authors and do not necessarily reflect the views of the National Science Foundation.