|
||
|
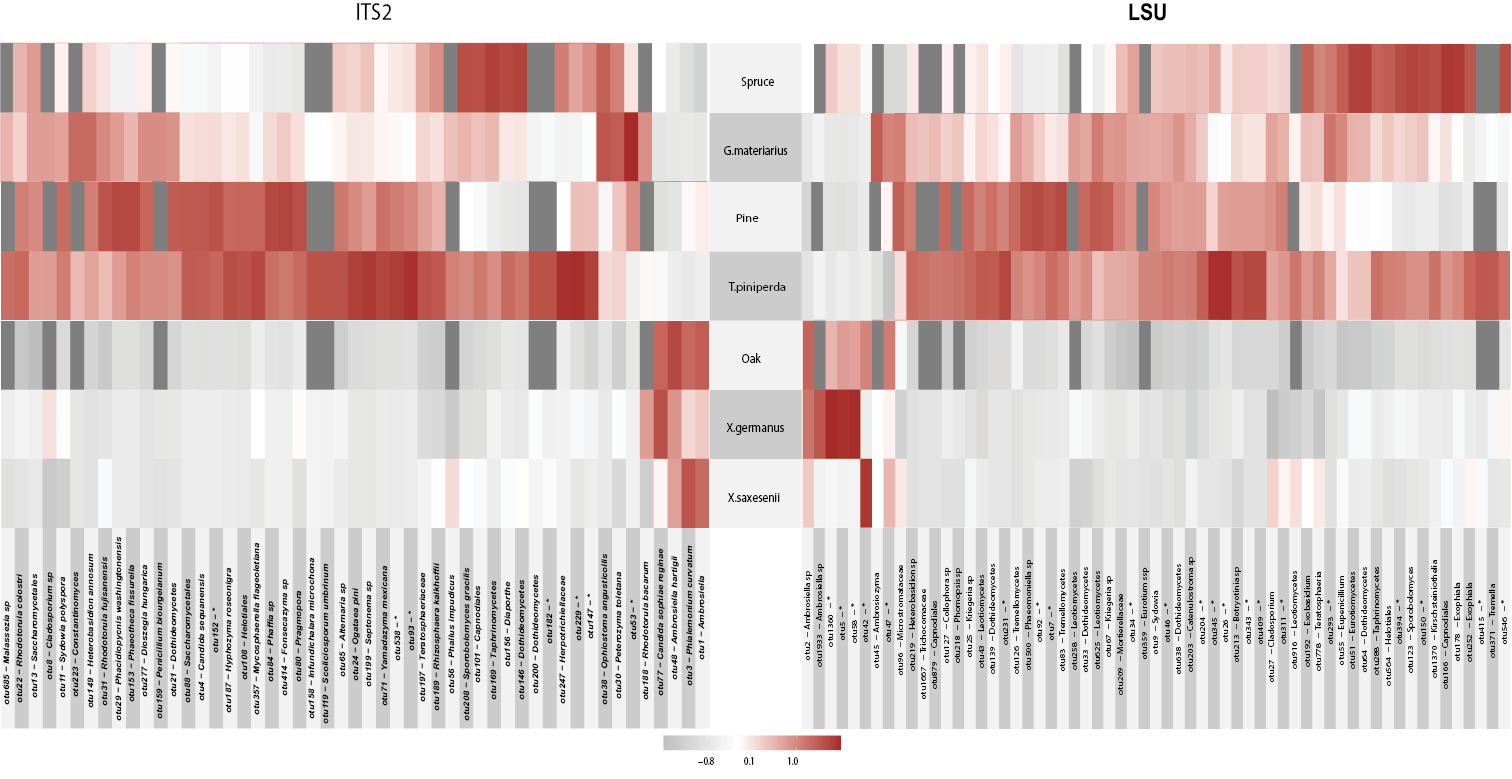
Heatmap using Pearson’s correlation coefficient between the OTUs generated from the ITS2 and LSU D1-D2 metabarcodes and the analysed beetle species and forest types. Rectangles indicate the strength of association between an OTU and beetle/forest (strongly negative, grey, to strongly positive, red). Fungal OTUs (on the horizontal axis) were classified to genus or species level where possible; they are shown in random order and cannot be linked taxonomically between both markers. |