|
||
|
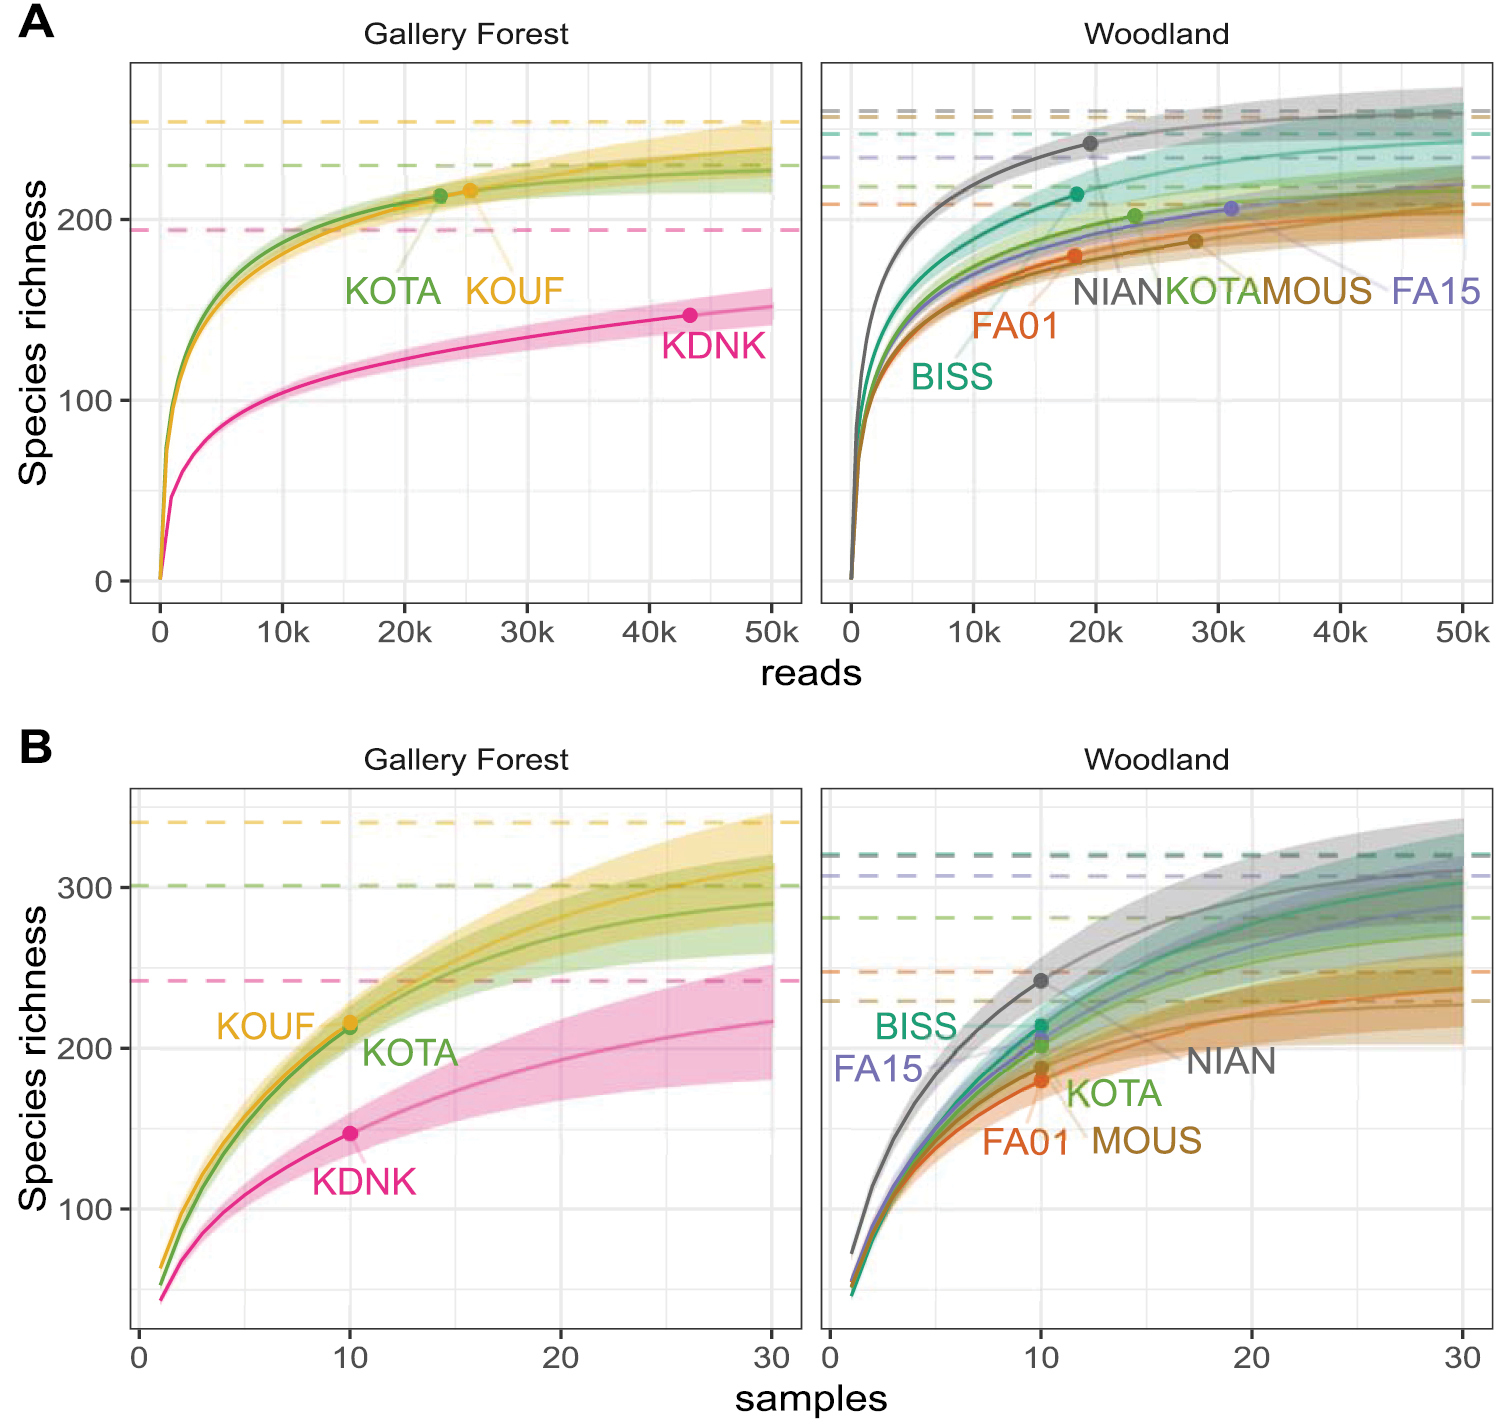
Species accumulation curves for each plot. Curves are based on SHs, by sequencing depth (A) and number of trees sampled (B), presented separately for three gallery forest sites (left panels) and six woodland sites (right panels). Points represent the observed species richness at the actual sequencing depth and trees sampled in A, B respectively. Thin lines represent the accumulation curve calculated by rarefaction (darker) and extrapolation (lighter); shaded regions represent the associated 95% confidence intervals. Dotted lines represent the asymptotic estimate for each site. |