|
||
|
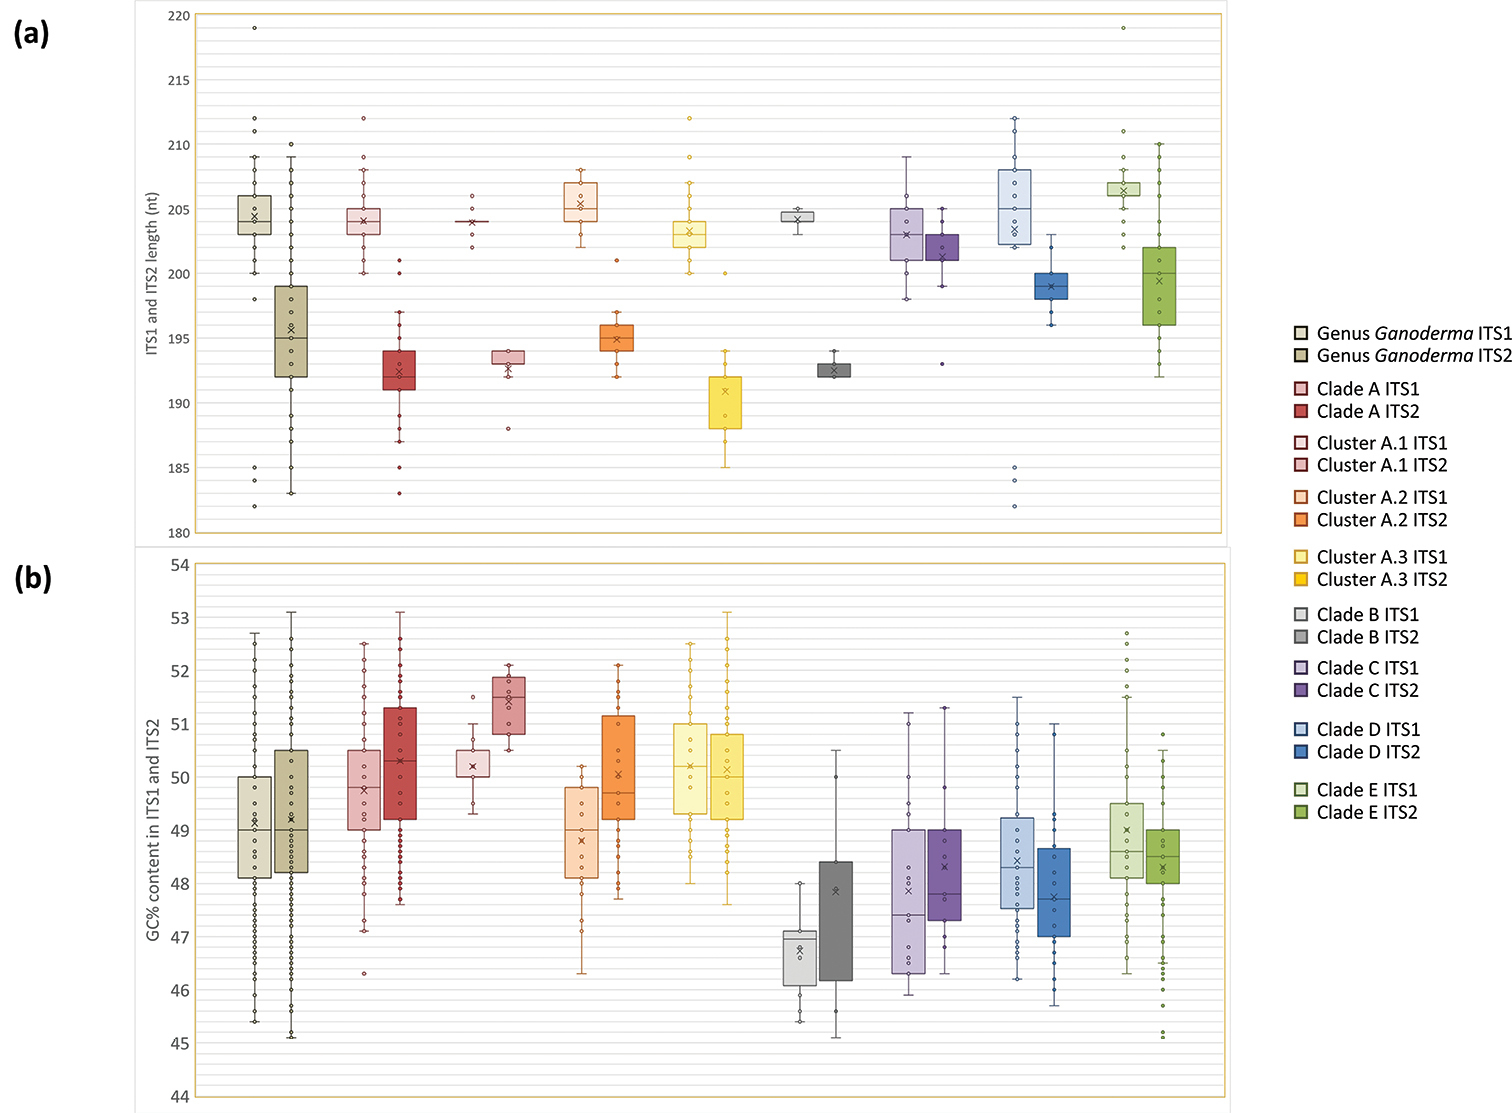
Box plots of a length (bases) and b GC (%) content of ITS1 and ITS2 sequences for each one of the main lineages (Clades/Clusters) of the genus Ganoderma. The size of each box represents 50% of the values, the black horizontal line within each box indicates the median, the ‘x’ represents the average value, the error bars represent interquartile ranges and circles indicate outliers. |