|
||
|
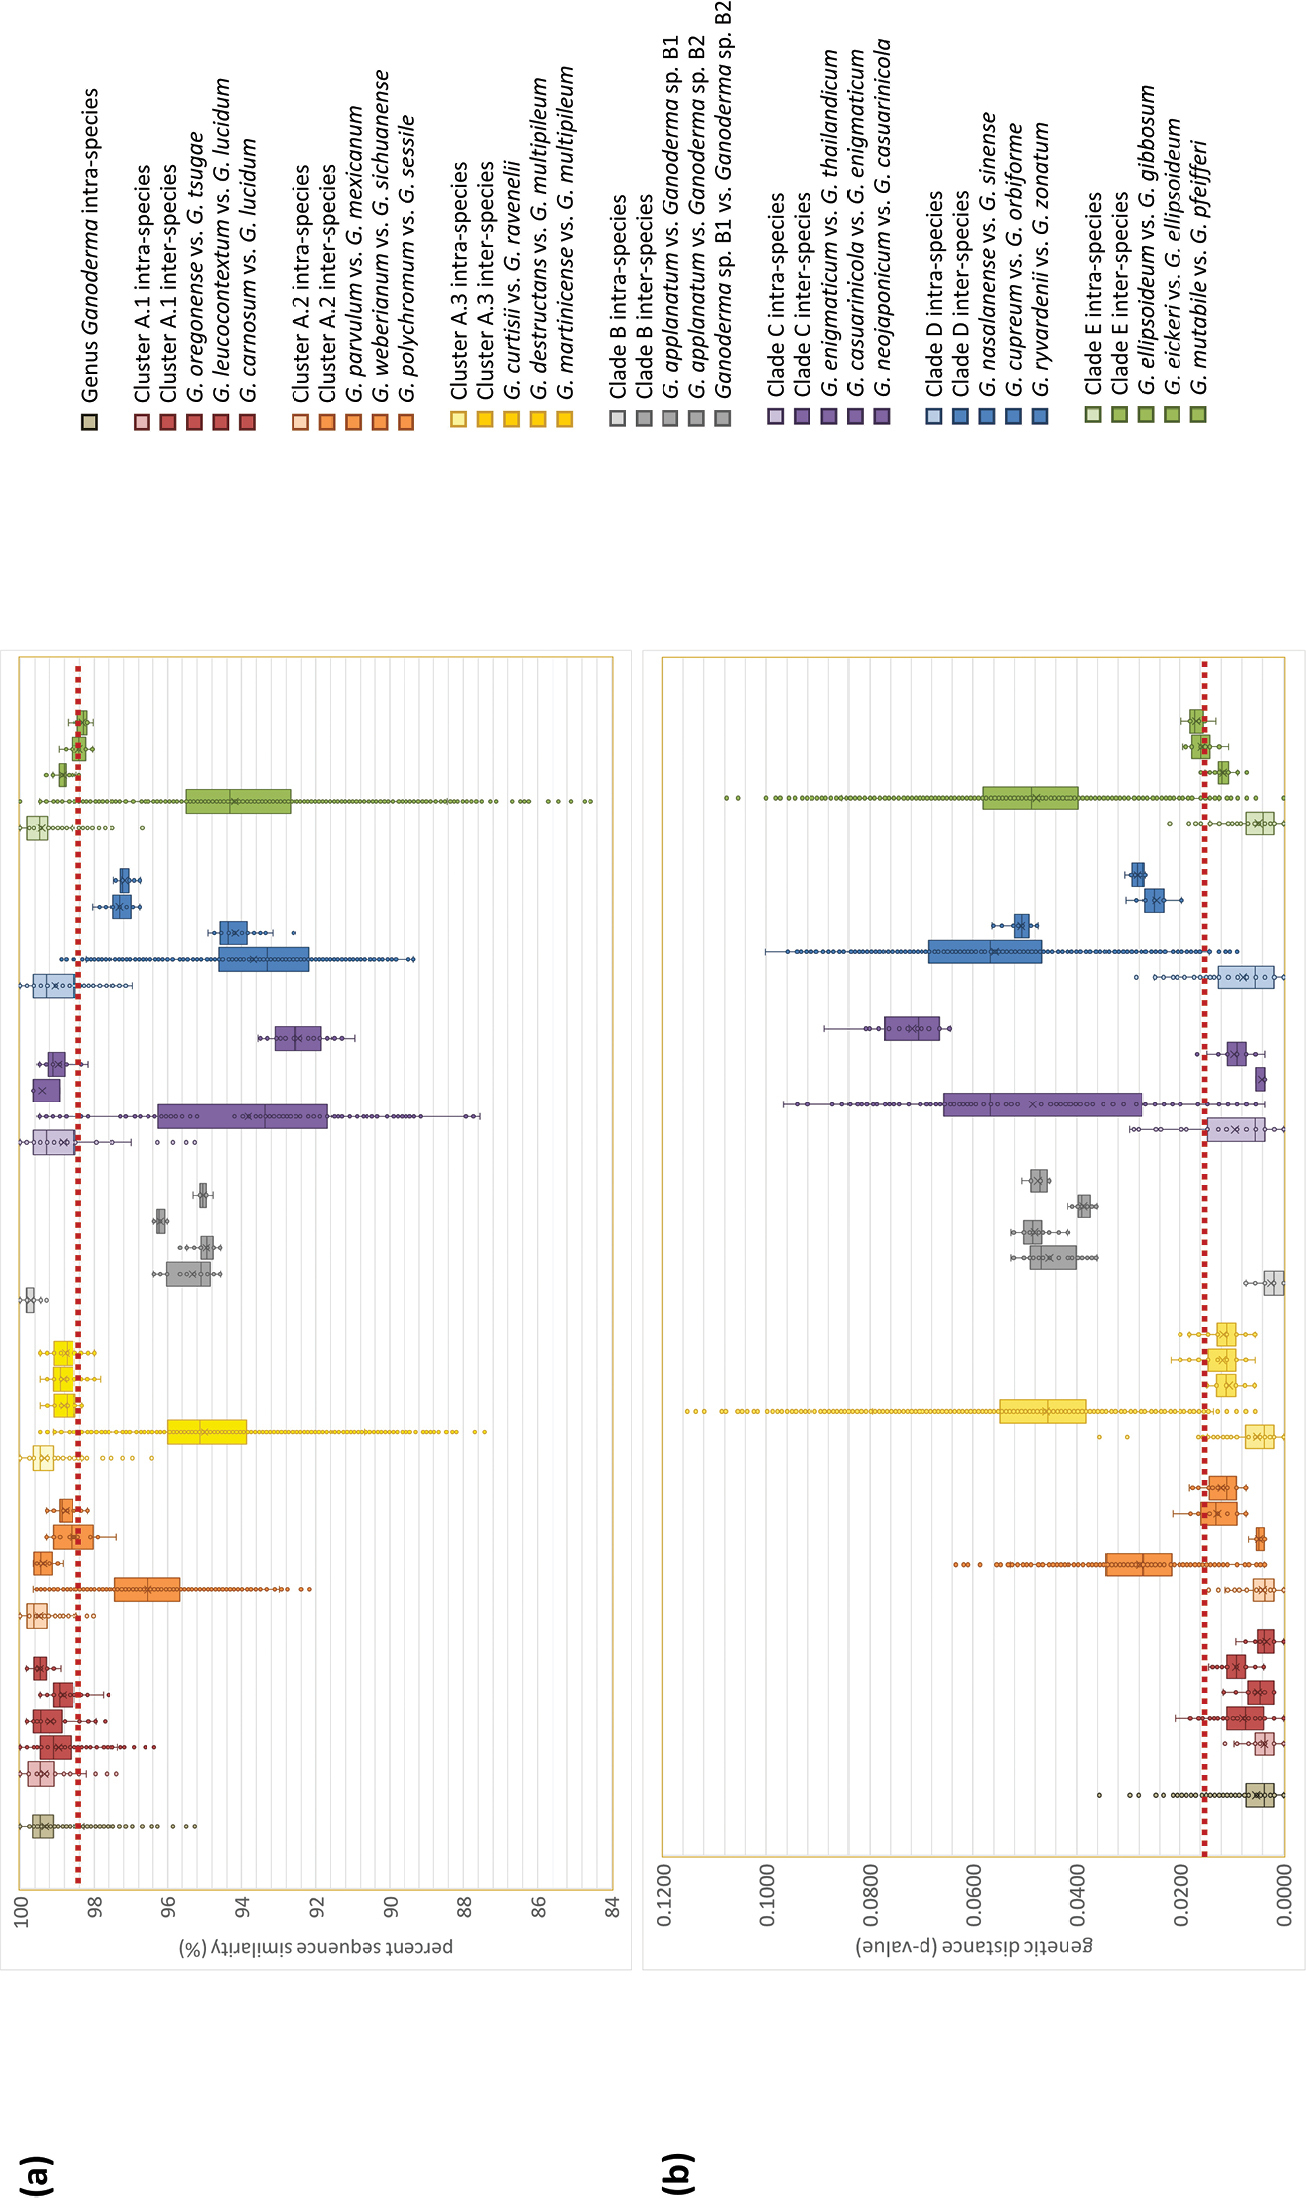
Box plots of a ITS sequence similarity (%) and b genetic distances (p-values) within (intra) and between (inter) Ganoderma species for each one of the main lineages (Clades/Clusters) of the genus, as well as pairwise comparisons between selected species. The size of each box represents 50% of the values, the black horizontal line within each box indicates the median, the ‘x’ represents the average value, the error bars represent interquartile ranges and circles indicate outliers. The red-dotted horizontal line, transversing the plots, represents the value levels accepted in this study for proposing new phylogenetic species. |