|
||
|
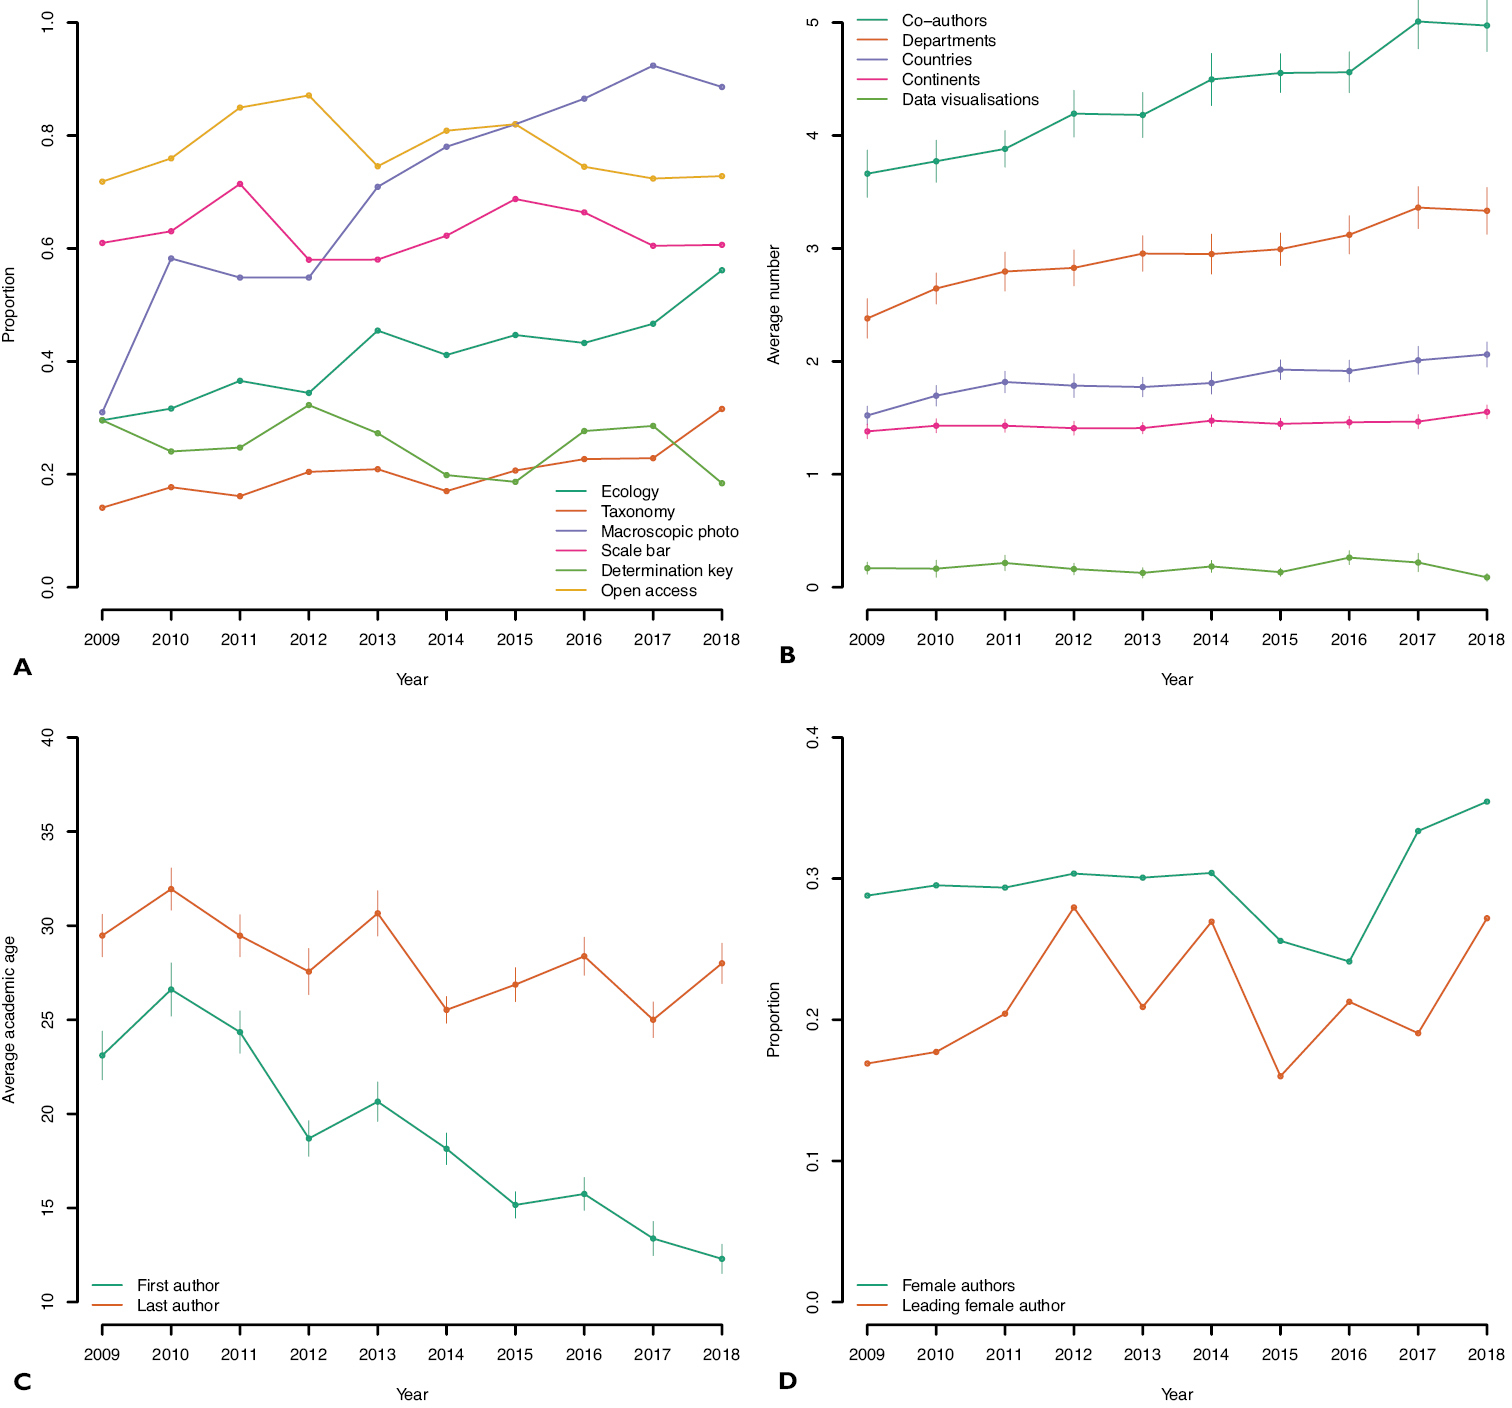
A Data and metadata in the description of fungal species 2009–2018. The x axis depicts year and the y axis depicts proportion of studies (from 0 to 1) fulfilling a specific criterion. Dark green – proportion of studies mentioning the word “ecology” or its variations; brown – proportion of studies giving a complete account of the taxonomic affiliation of the new species (family, order, and phylum); purple – proportion of studies with a macroscopic colour photo/illustration of the new species; pink – proportion of studies with macroscopic photos, that also indicate the size of the depicted object through a scale bar or a fiducial marker; light green – proportion of studies with an identification key; yellow – proportion of openly available papers for each year as assessed in 2020 B demographical and publication trends showing the average number of co-authors (dark green), departments (brown), countries (purple), continents (pink), and number of data visualizations (light green) over time. The bars indicate the yearly standard error C the average academic age of the first (green) and last (brown) co-author over time. The bars indicate the yearly standard error D the proportion of female co-authors (green) over time plus the proportion of female lead authors (brown). |