|
||
|
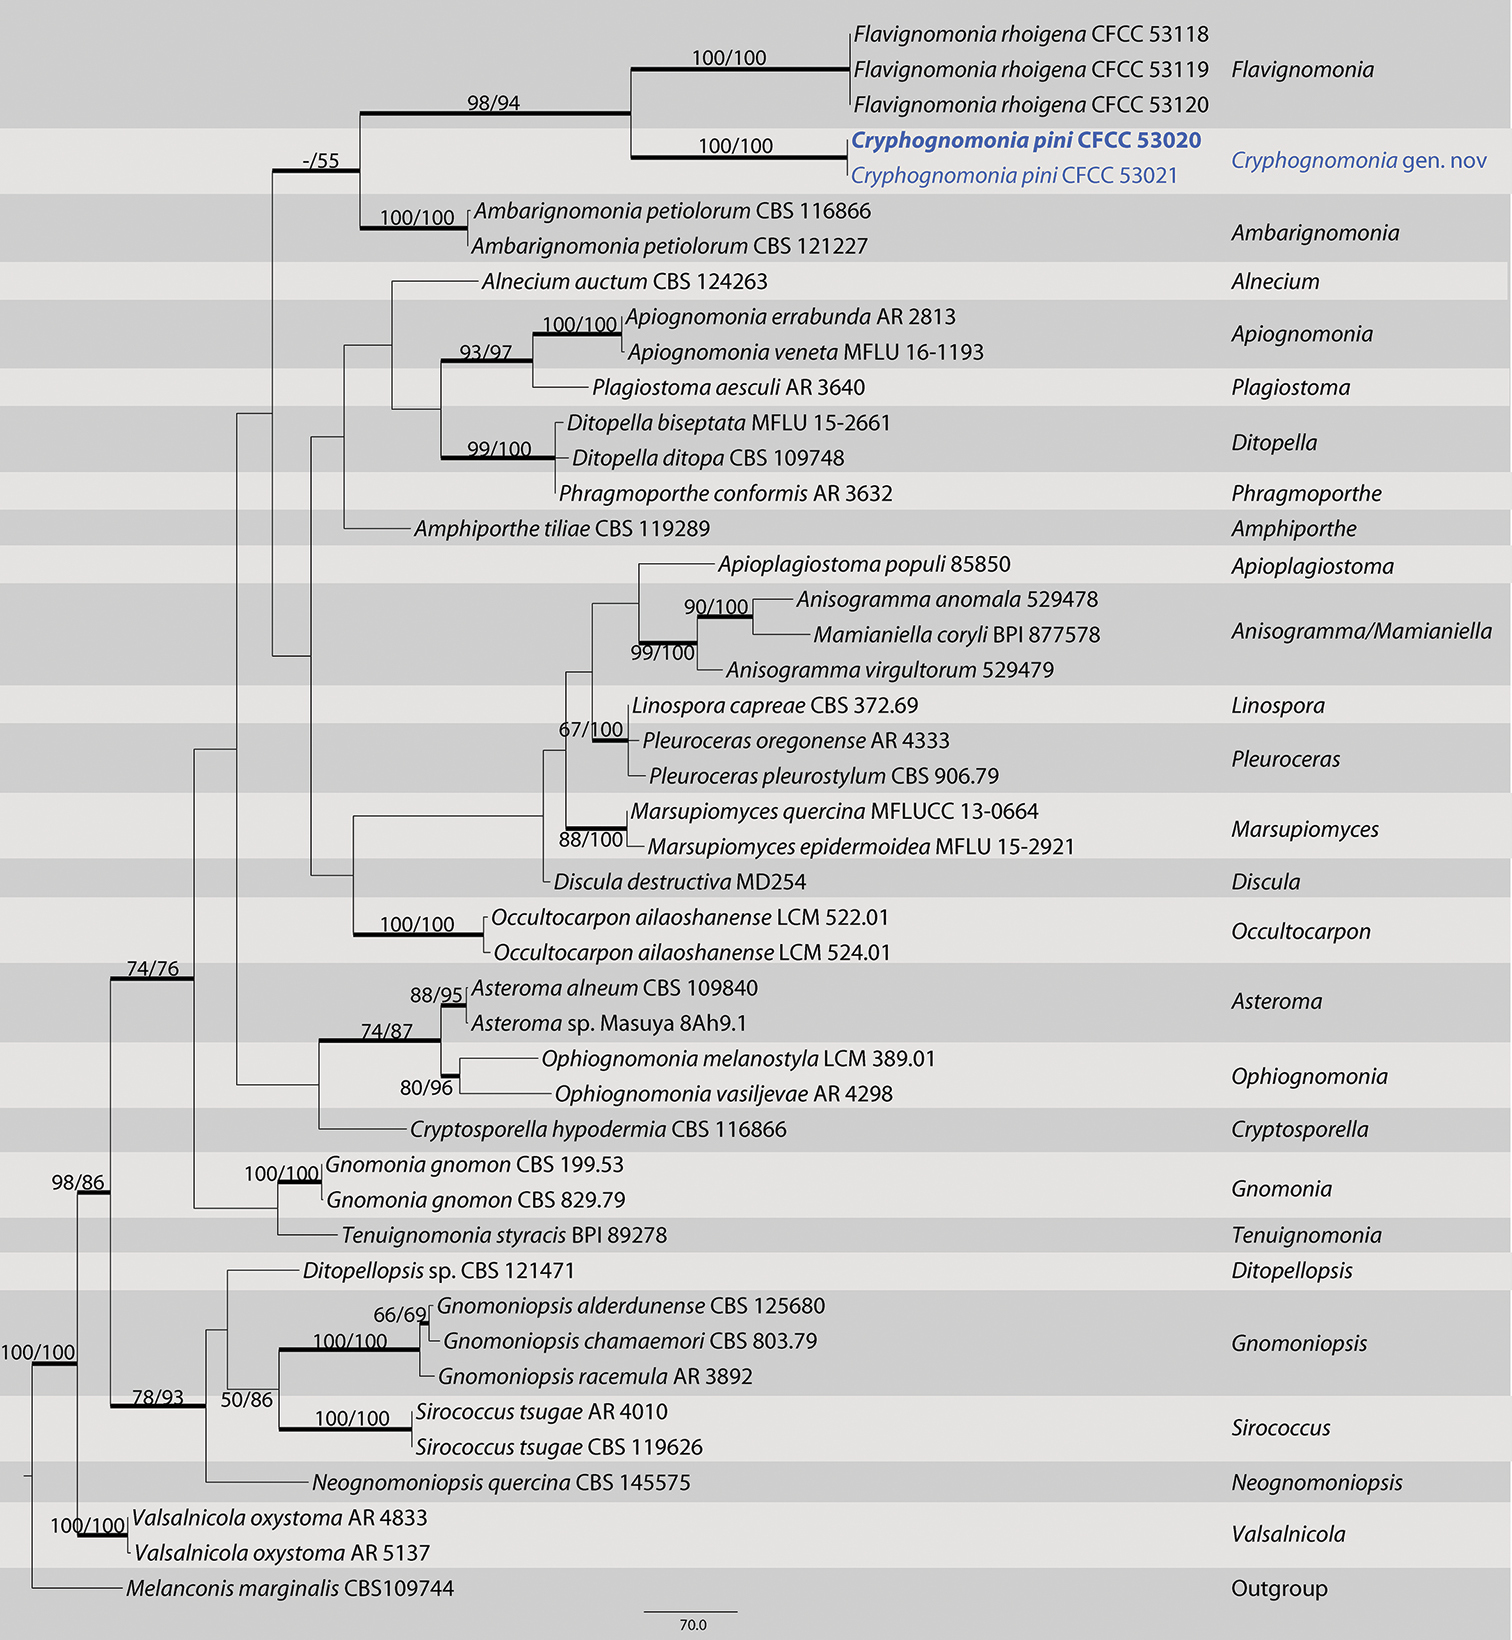
Maximum parsimony phylogram of Gnomoniaceae based on a combined matrix of ITS, LSU, tef1 and rpb2 genes. The MP and ML bootstrap support values above 50% are shown at the first and second position, respectively. Thickened branches represent posterior probabilities above 0.90 from BI. Scale bar: 80 nucleotide substitutions. Strains in this study are in blue and ex-type strains are in blod. |