|
||
|
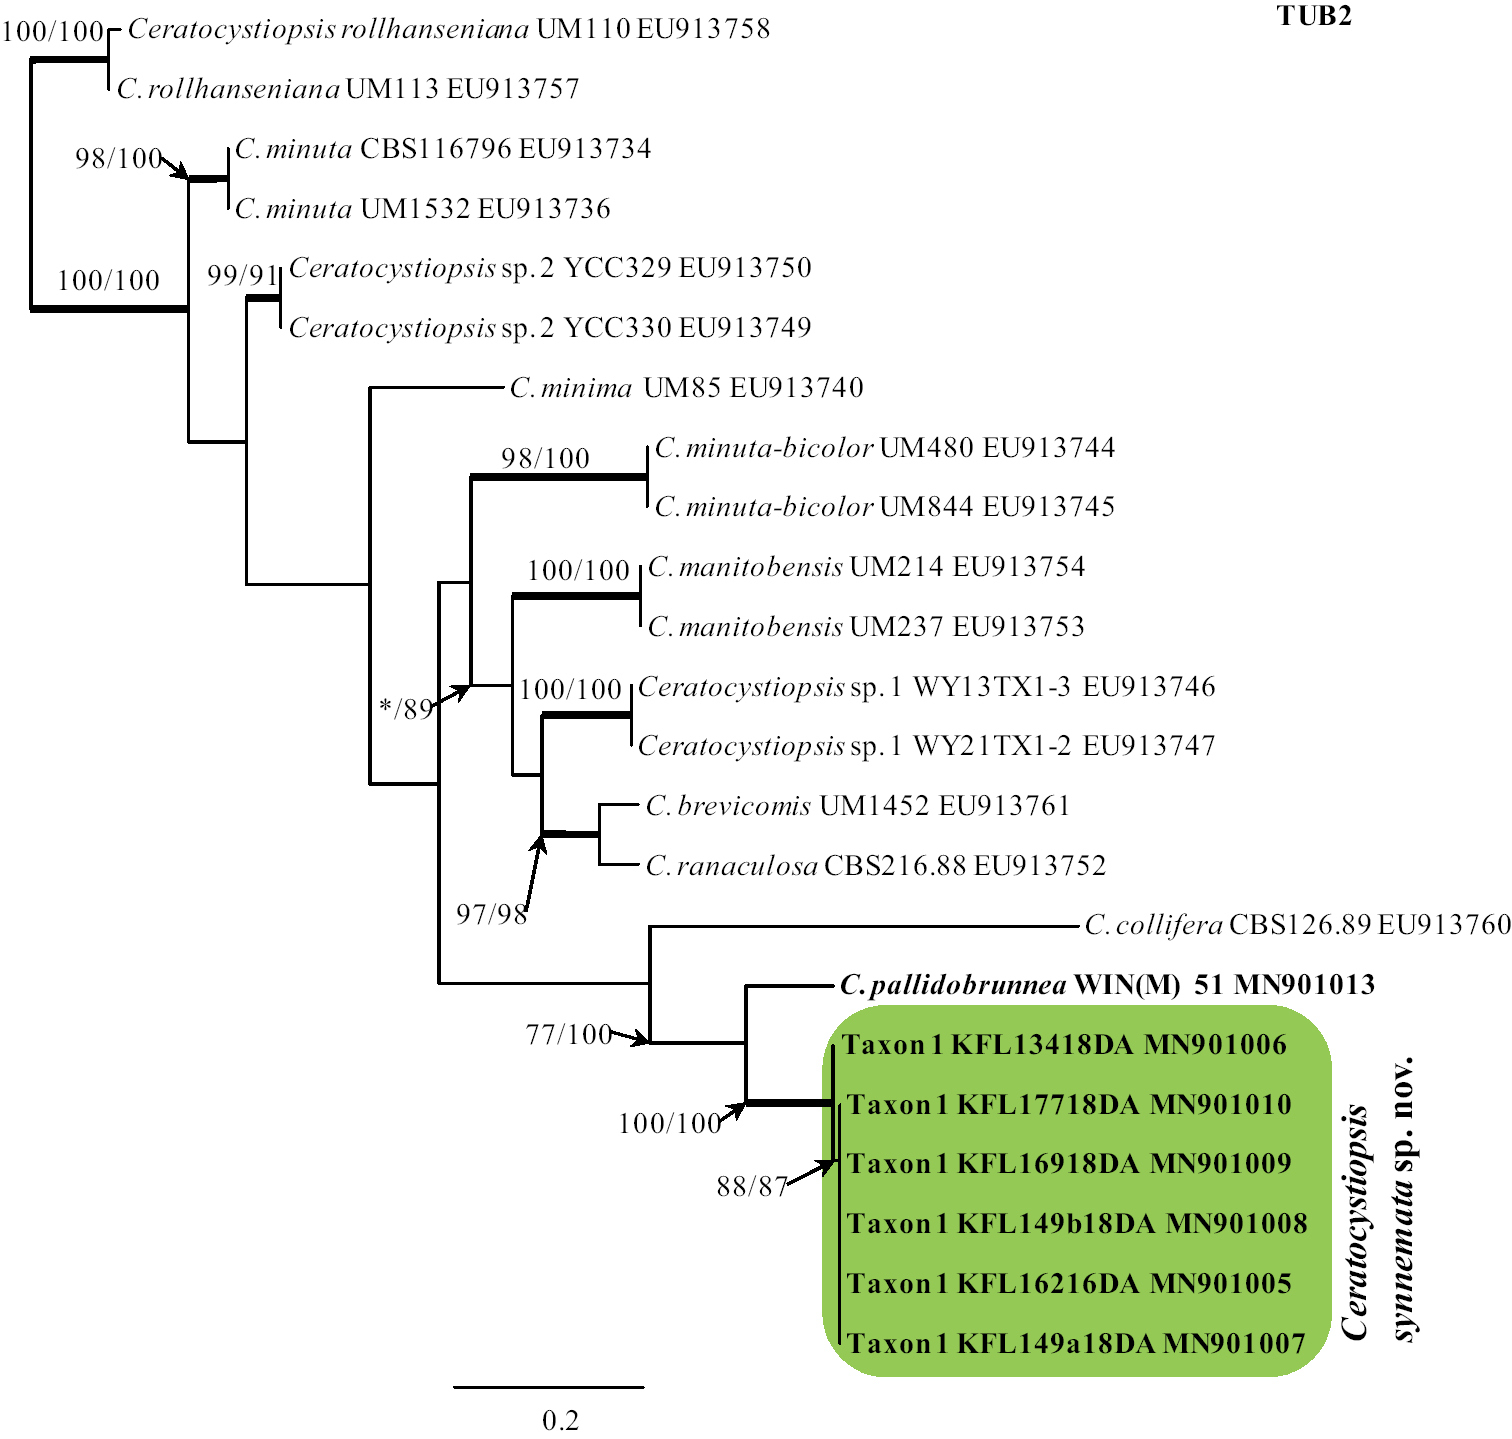
Phylogram obtained from Maximum Likelihood (ML) analyses of TUB2 data for the Ceratocystiopsis spp. Sequences obtained during this study are presented in bold type. The Bootstrap values ≥ 75% for ML and Maximum Parsimony (MP) analyses are presented at nodes as follows: ML/MP. Bold branches indicate posterior probabilities values ≥ 0.95 obtained from Bayesian Inference (BI) analyses. * Bootstrap values <75%. The tree is drawn to scale (see bar) with branch length measured in the number of substitutions per site. |