|
||
|
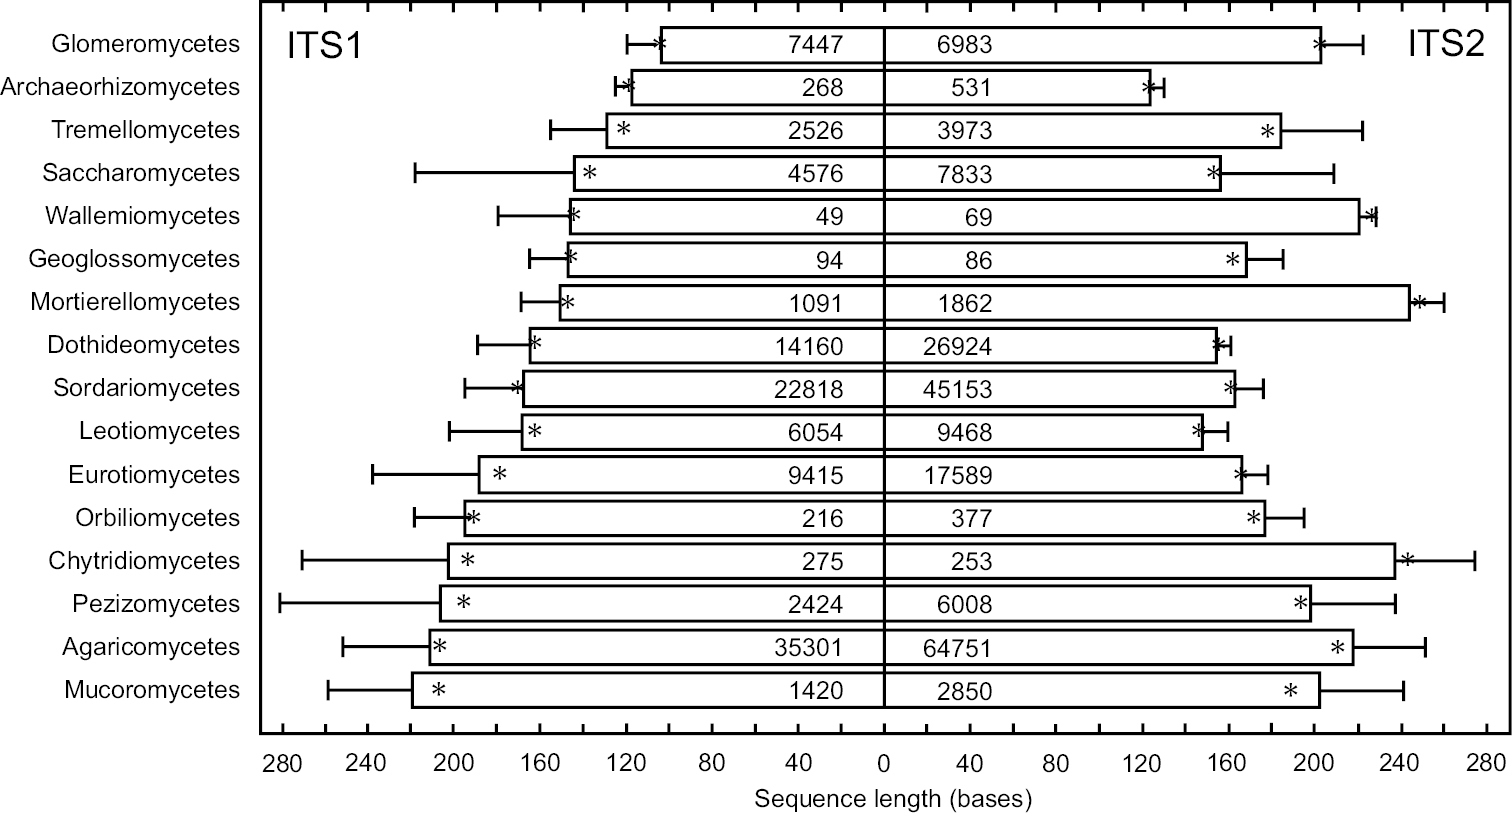
Differences in sequence length in the ITS1 and ITS2 barcodes of 16 most abundant fungal classes as revealed based on amplicon libraries in this study. Columns, asterisks, and error bars represent mean and median values and standard deviation, respectively. Numbers inside bars indicate the number of sequences analyzed (n). Taxa are ordered by average length of the ITS1 region. |