|
||
|
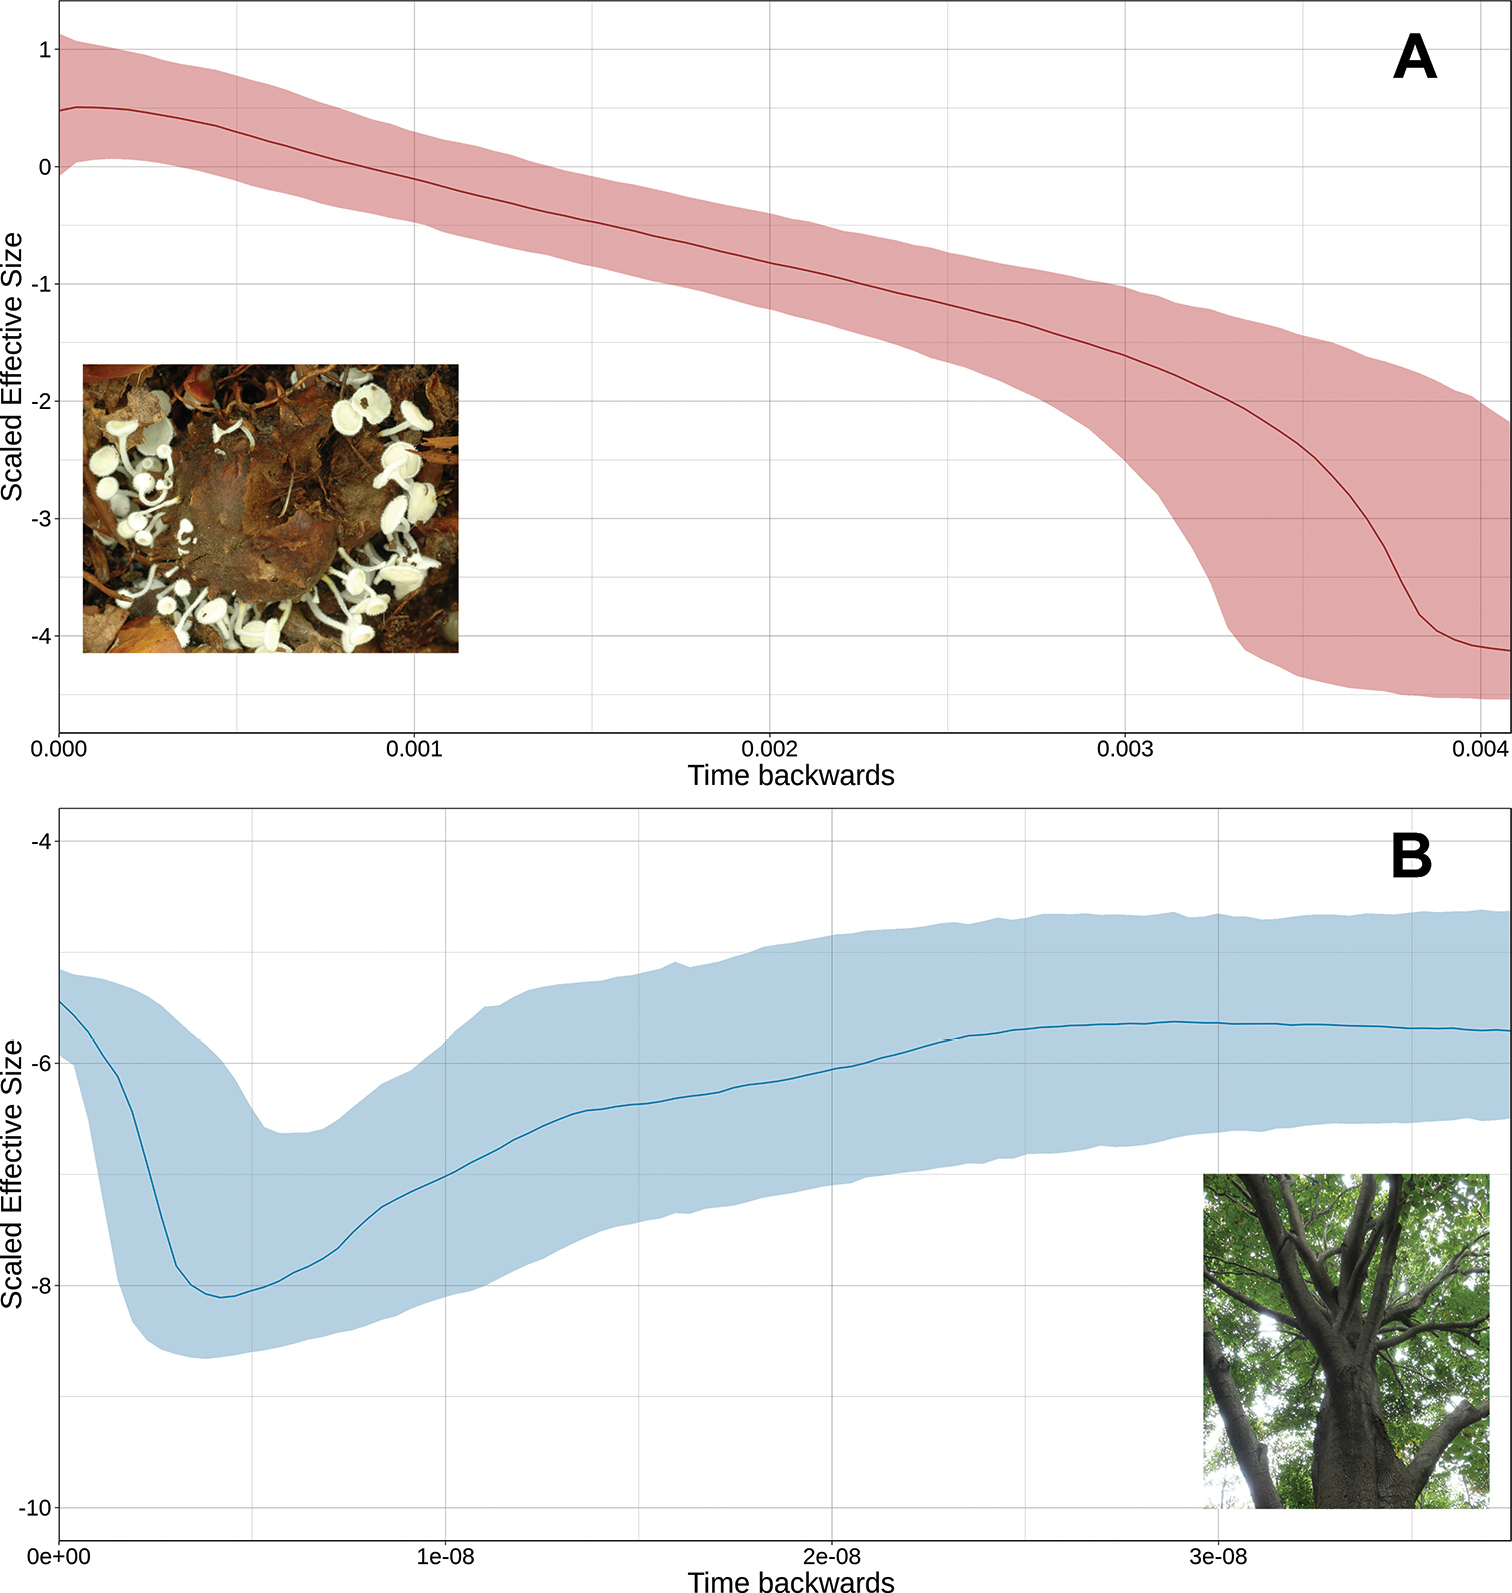
Bayesian Skyride Plot for A Dasyscyphella longistipitata using the concatenated ITS and beta-tubulin, and B Fagus crenata, using the reported sequences in Fujii et al. (2002). The y-axis represents the scaled effective population size (log10(Ne*u)), and the x-axis represents time as substitutions per site. Shaded area shows the 95% HPD of the posterior distribution. Solid lines show the median value of effective population size. Dotted shades show the upper and lower 95% highest posterior density. Note that the x-axis in A and B are non-equivalent to each other. |