|
||
|
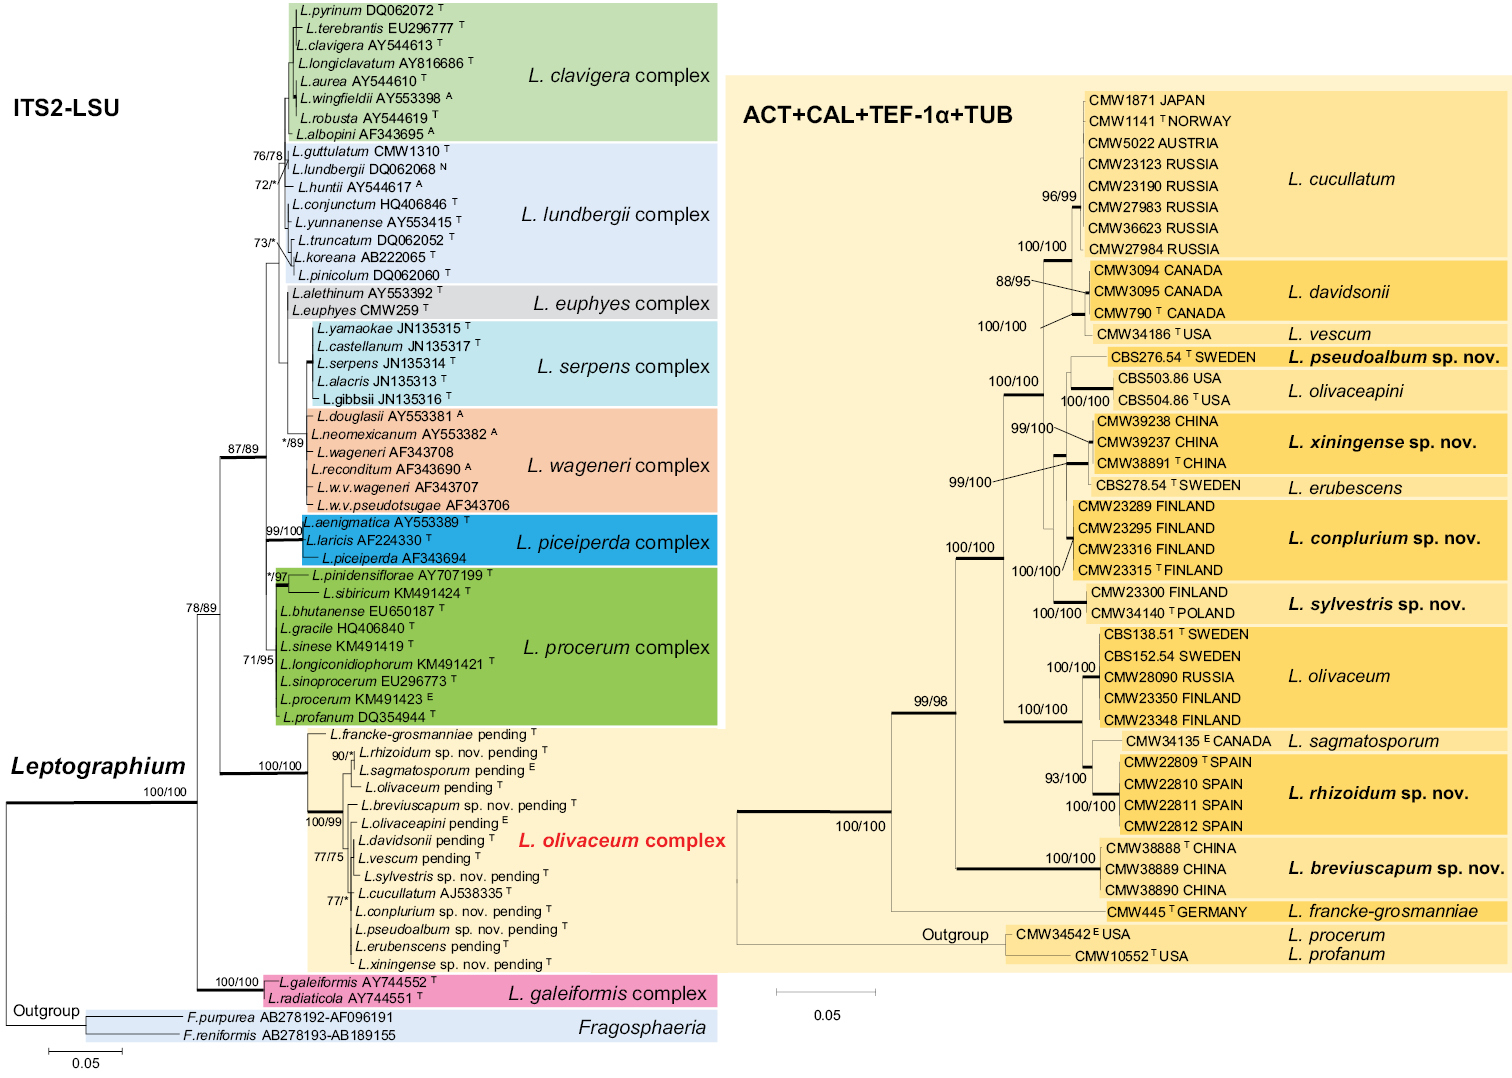
Left side: ML tree of the genus Leptographium generated from the ITS2-LSU DNA sequence data. Sequences generated from this study are printed in bold type. Bold branches indicate posterior probabilities values ≥0.95. Bootstrap values ≥75% are recorded at nodes as ML/MP. * Bootstrap values <75%. Scale bar represents 5 nucleotide substitutions per 100 nucleotides. Right side: ML trees of the L. olivaceum complex generated from the DNA sequences of combined four protein-coding gene regions, including ACT, CAL, TEF-1α, and TUB. Bold branches indicate posterior probabilities values ≥0.95. Bootstrap values ≥75% are recorded at nodes as ML/MP. * Bootstrap values <75%. Scale bar represents 5 nucleotide substitutions per 100 nucleotides. |