|
||
|
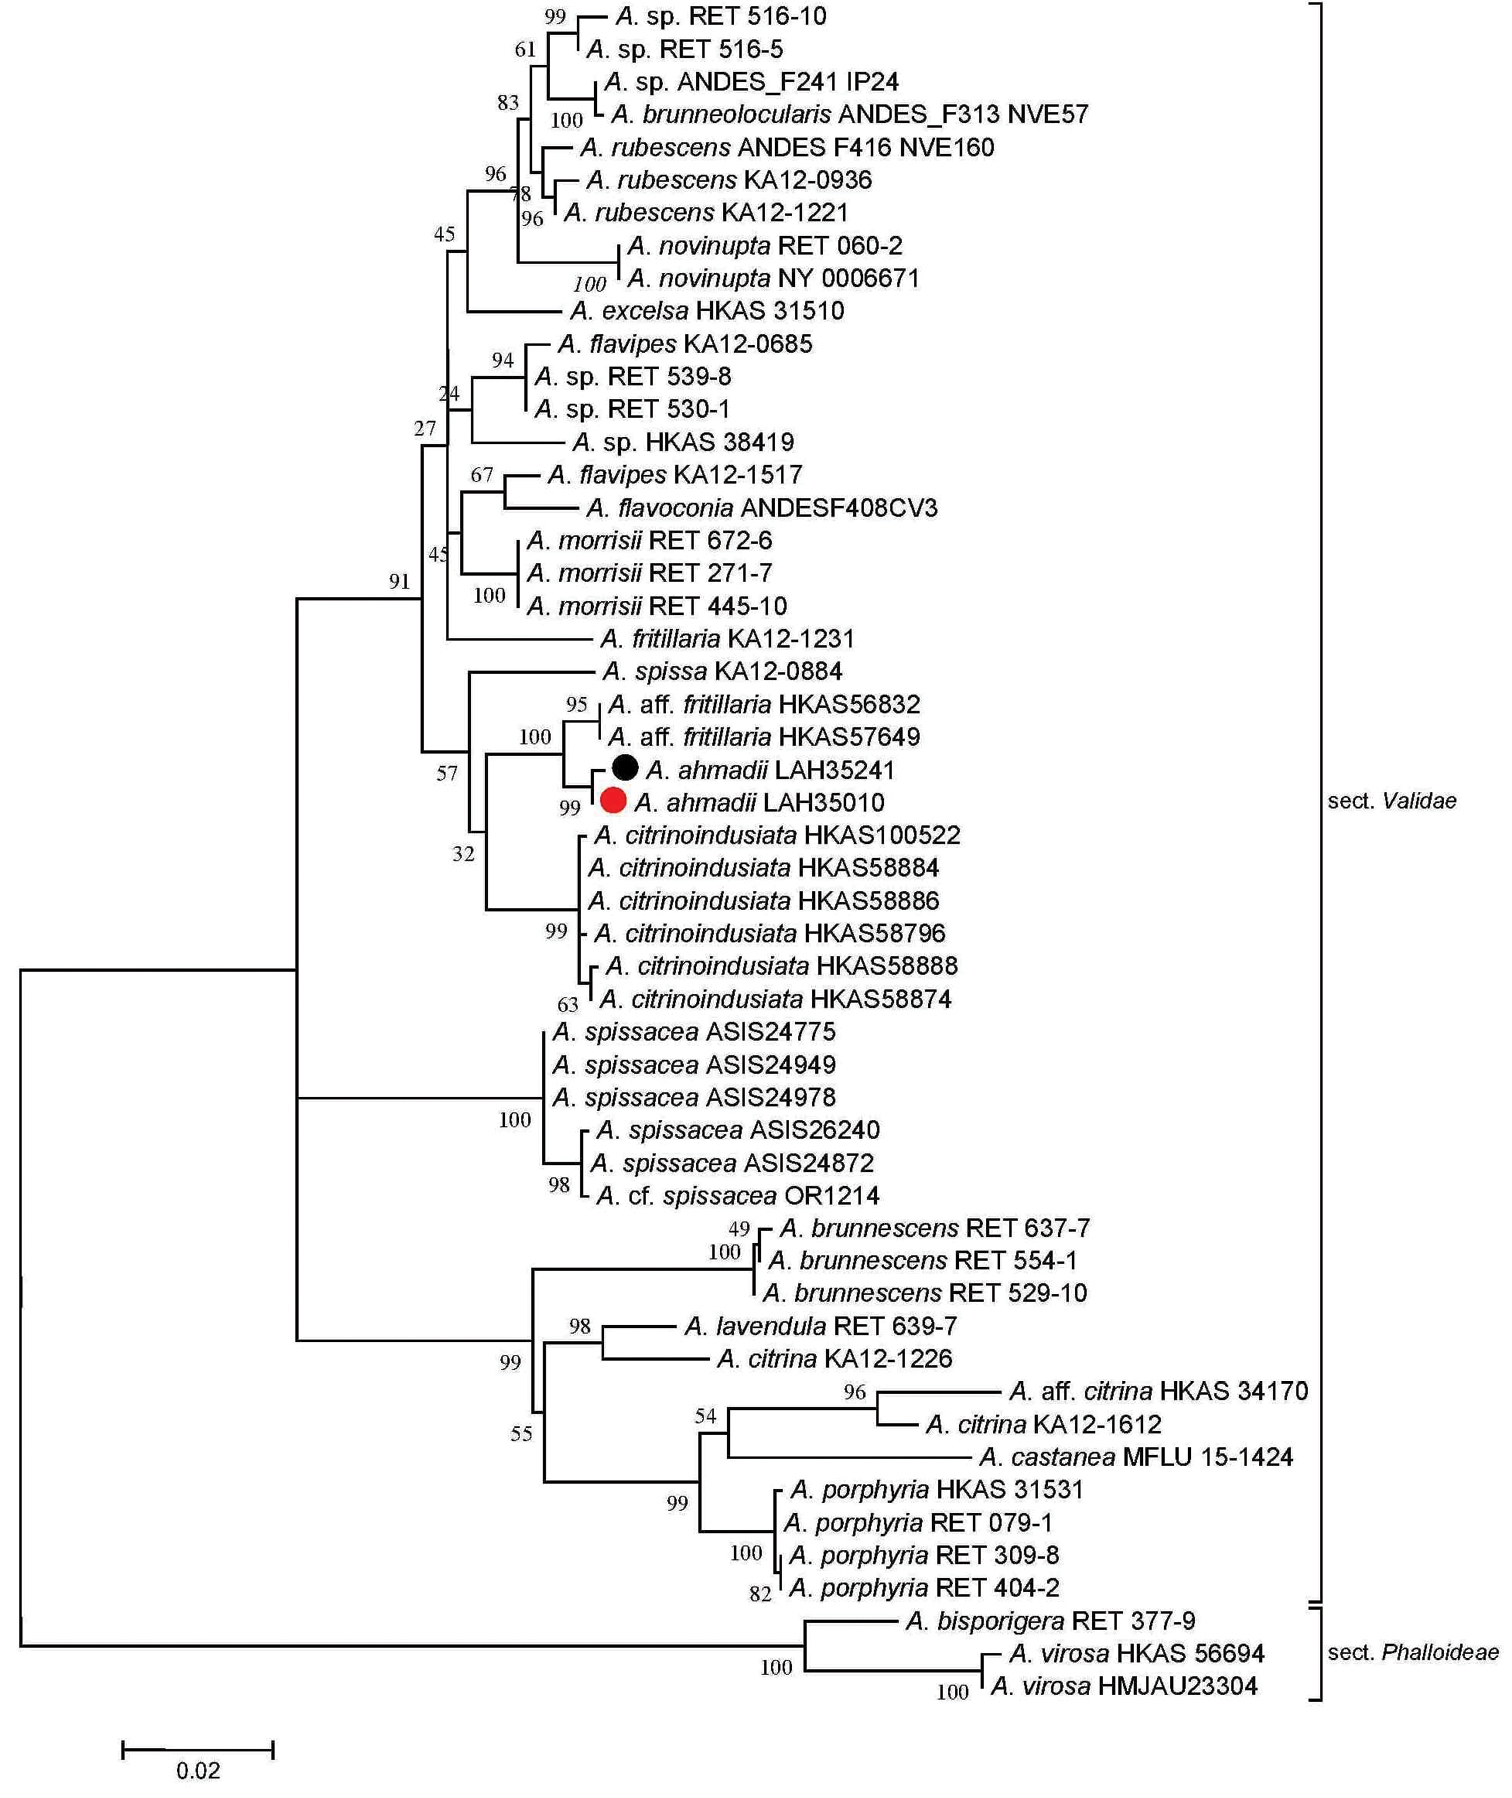
Molecular phylogenetic analysis of ITS+LSU sequences by using the maximum likelihood method based on the Tamura-Nei model (Tamura and Nei 1993). A discrete gamma distribution was used to model evolutionary rate differences among sites (5 categories (+G, parameter = 0.2250)). The rate variation model allowed for some sites to be evolutionarily invariable ([+I], 43.3848% sites). The tree is drawn to scale, with branch lengths measured in the number of substitutions per site. The analysis involved 52 nucleotide sequences. There were a total of 1760 positions in the final dataset. Sequences generated during the present investigation are marked with bullets. Red represents the holotype. |