|
||
|
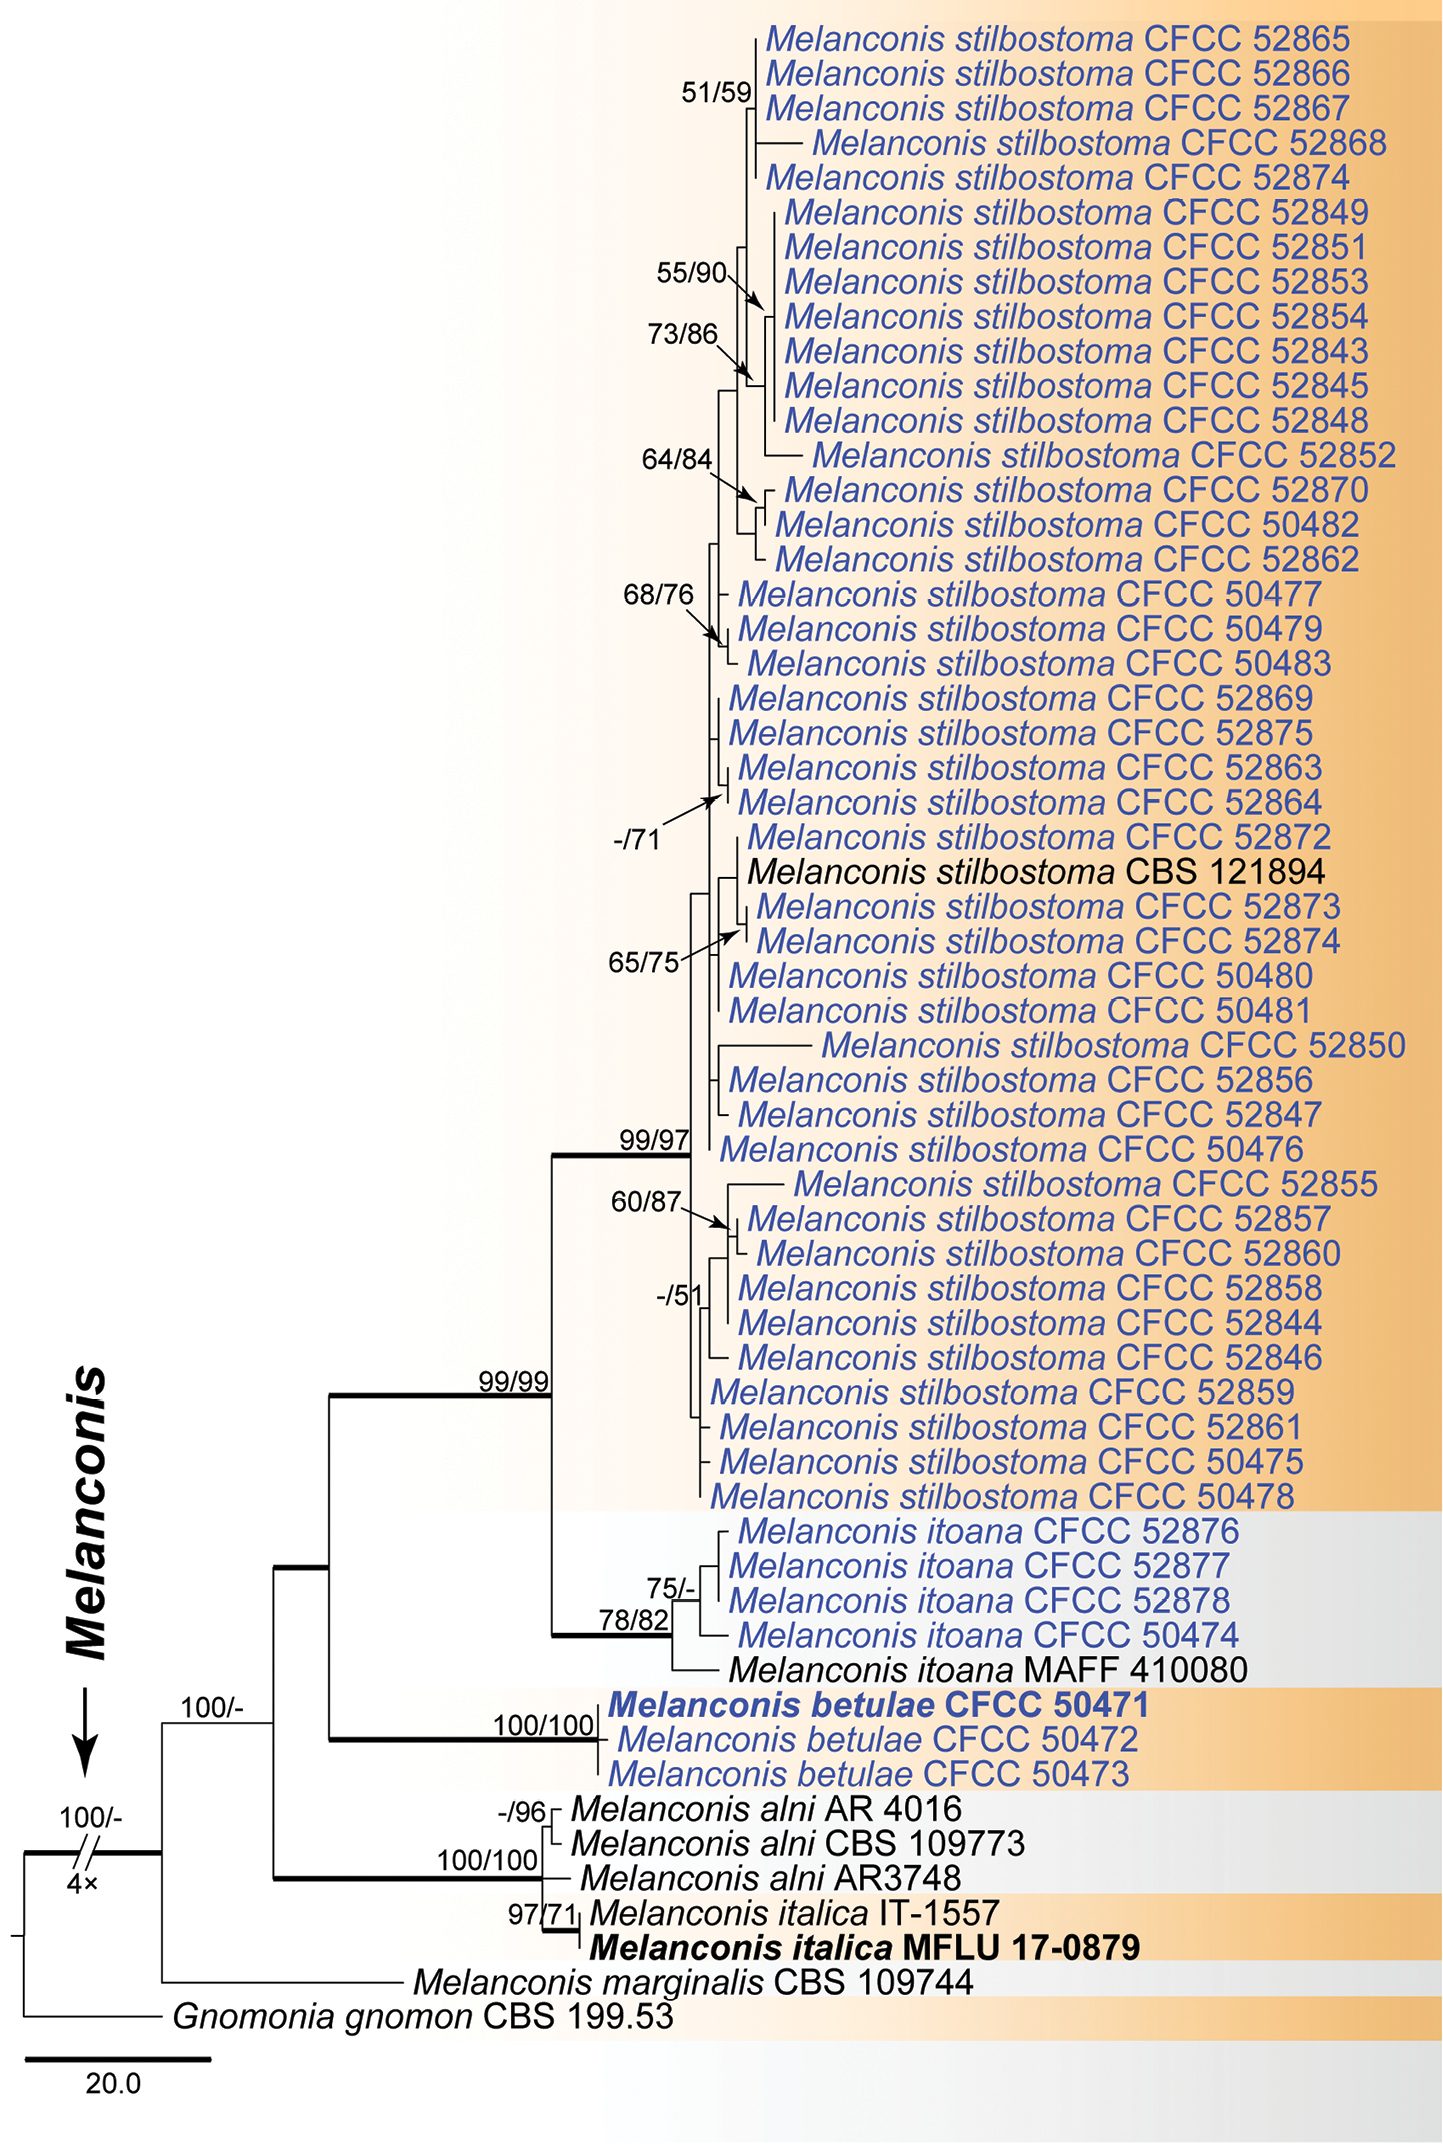
Phylogram of Melanconis (Melanconidaceae) obtained from an MP analysis of a combined matrix of ITS, LSU, RPB2 and TEF1-α. MP and ML bootstrap support values above 50% are shown at the first and second position, respectively. Thickened branches represent posterior probabilities above 0.95 from BI. Scale bar = 20 changes. Type species are in bold. Strains obtained in the current study are in blue. |