|
||
|
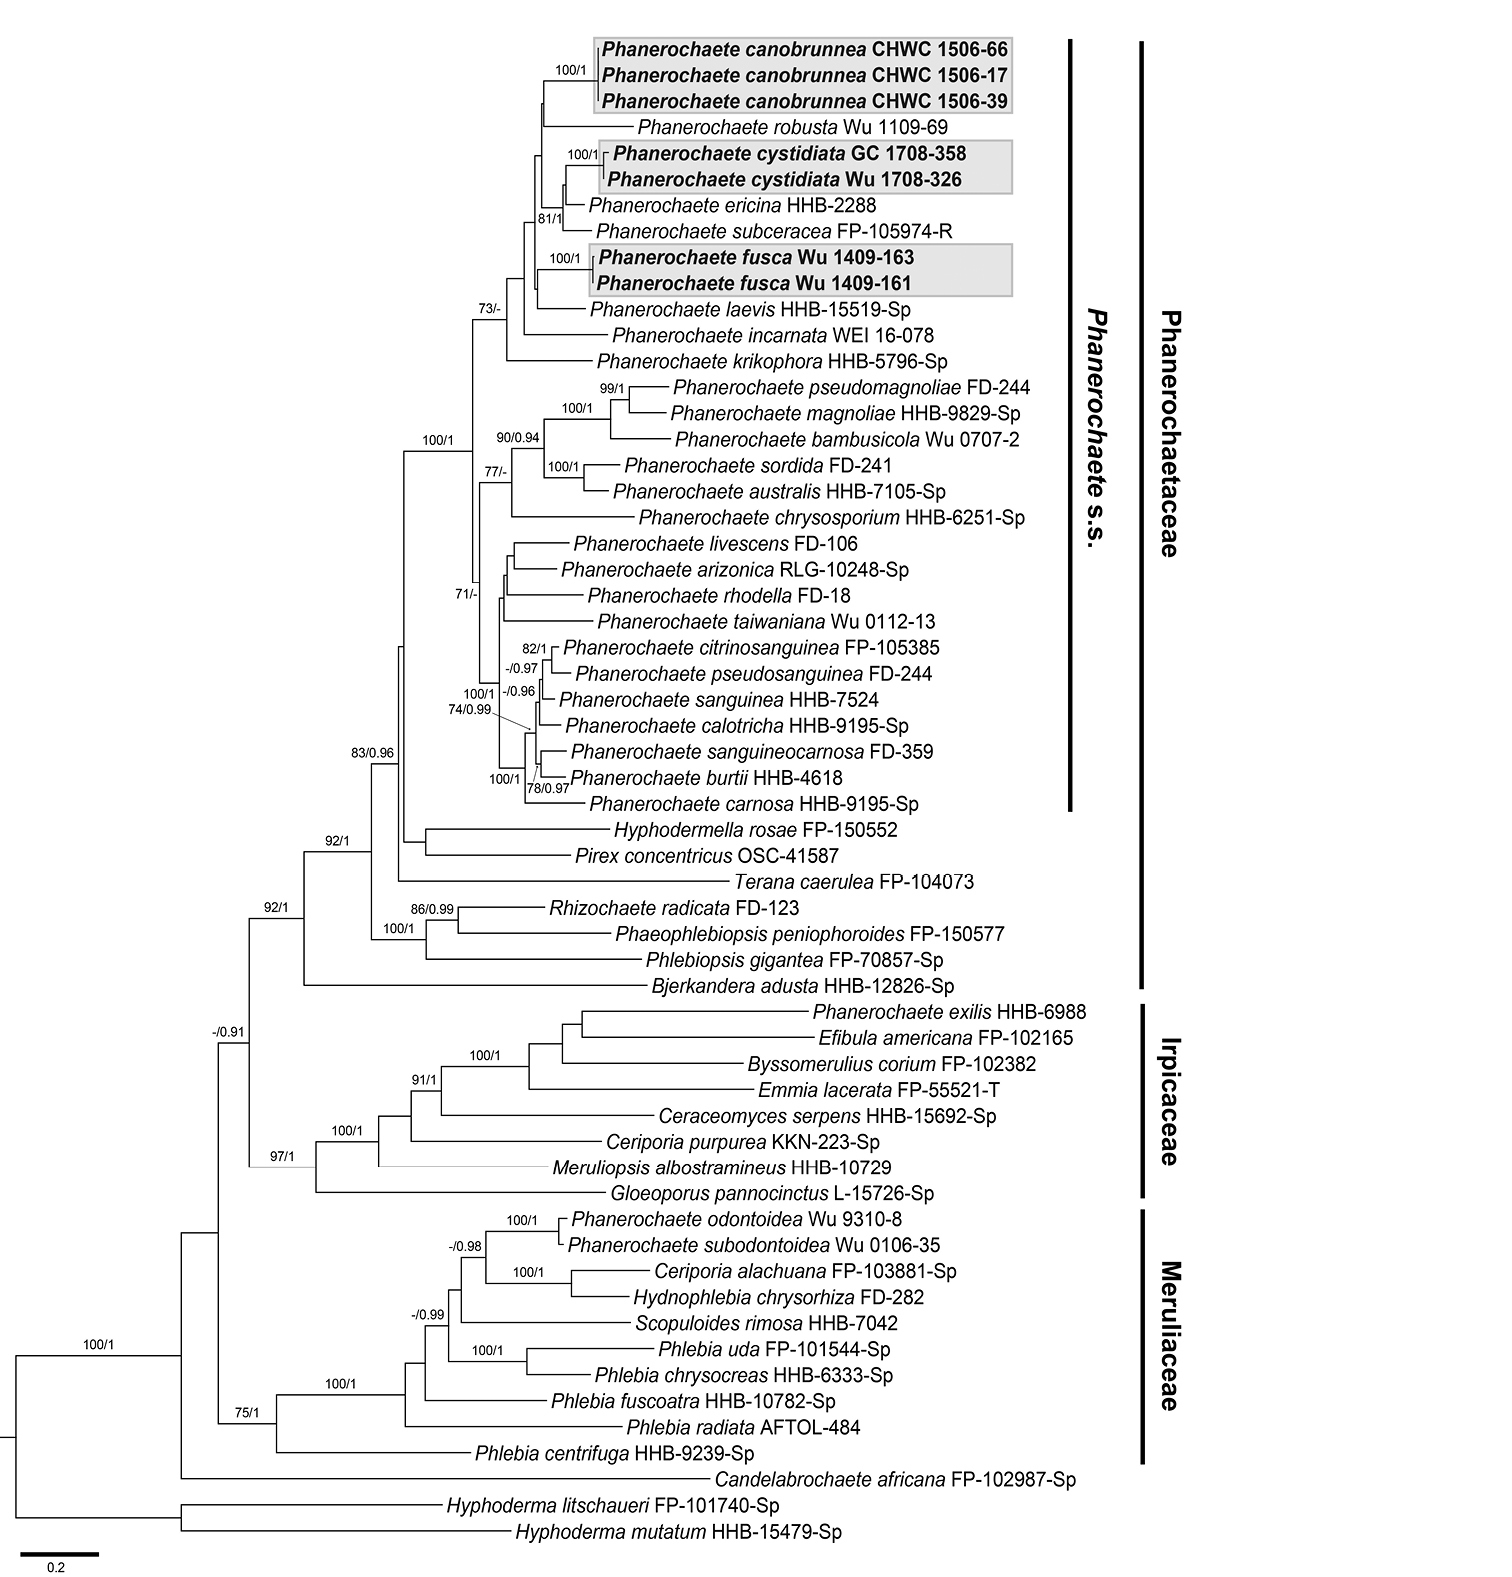
Phylogram inferred from Maximum likelihood analysis of the concatenated 5.8S+nuc 28S+rpb1 dataset of representative taxa in the phlebioid clade of Polyporales. Branches are labelled with Maximum likelihood bootstrap values ≥70% and Bayesian posterior probabilities ≥0.9. Studied taxa are shaded with greyish boxes. Scale bar = substitutions per site. |