|
||
|
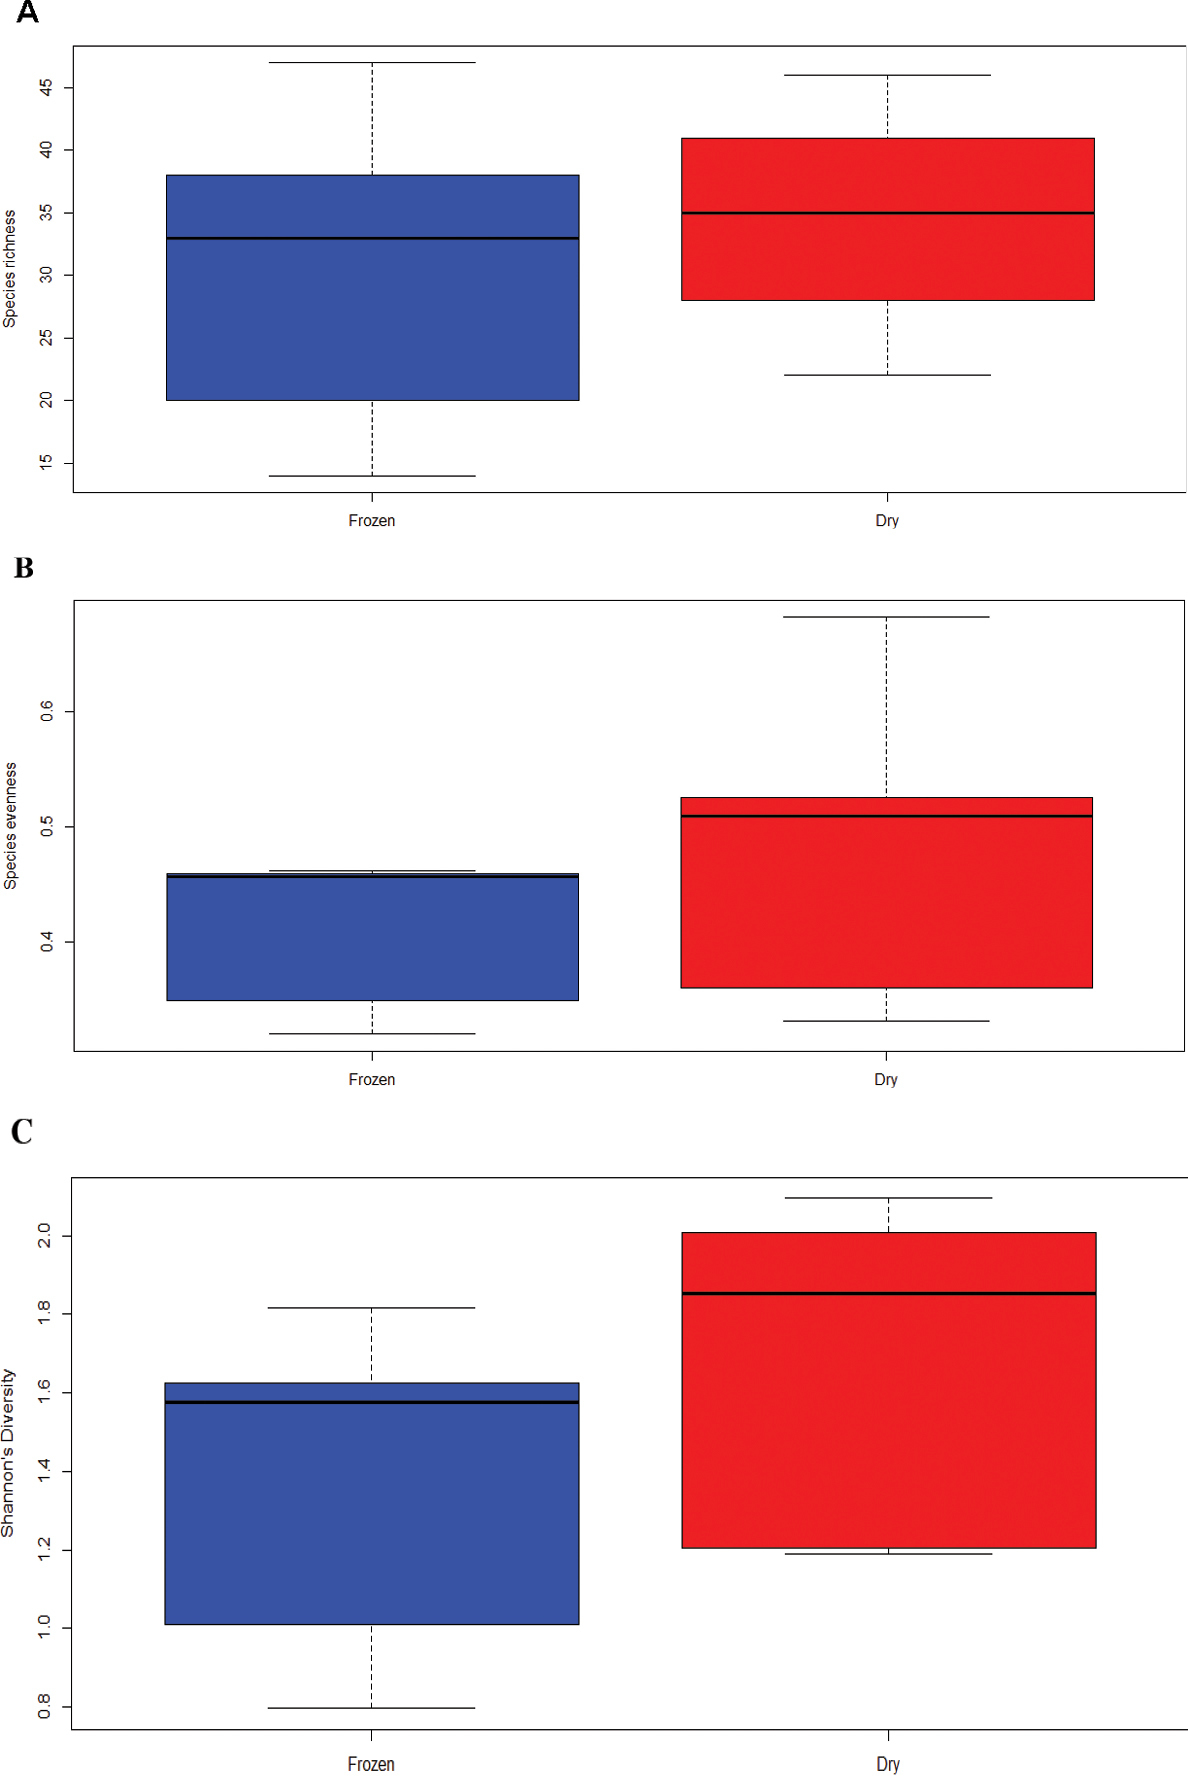
Box plots for values of species richness (A), species evenness (B), and Shannon’s diversity index (C) between our two preservation methods. Box plots: middle line, median; box, interquartile range; whiskers, 5th and 95th percentiles. |
|
||||||||
| Part of: Shumskaya M, Lorusso N, Patel U, Leigh M, Somervuo P, Schigel D (2023) MycoPins: a metabarcoding-based method to monitor fungal colonization of fine woody debris. MycoKeys 96: 77-95. https://doi.org/10.3897/mycokeys.96.101033 |