Research Article |
|
Corresponding author: Taavi Riit ( taavi.riit@ut.ee ) Academic editor: Thorsten Lumbsch
© 2016 Taavi Riit, Leho Tedersoo, Rein Drenkhan, Eve Runno-Paurson, Harri Kokko, Sten Anslan.
This is an open access article distributed under the terms of the Creative Commons Attribution License (CC BY 4.0), which permits unrestricted use, distribution, and reproduction in any medium, provided the original author and source are credited.
Citation:
Riit T, Tedersoo L, Drenkhan R, Runno-Paurson E, Kokko H, Anslan S (2016) Oomycete-specific ITS primers for identification and metabarcoding. MycoKeys 14: 17-30. https://doi.org/10.3897/mycokeys.14.9244
|
Abstract
Microbial metabarcoding studies using high throughput sequencing technologies generate unprecedented amounts of DNA sequence data and make it possible to determine not only the composition of the communities but also the underlying factors powering the evolution of these communities. Despite the potential of community level studies in helping to better understand the ecology of pathogens and to manage the losses caused by them, very few oomycete addressing metabarcoding studies have been carried out and with highly variable results. The aim of this study was to develop new oomycete-specific ITS region PCR primers with improved specificity for metabarcoding and identification of oomycetes. The modified ITS1oo and the newly developed ITS3oo primers show improved in silico specificity for oomycetes and when paired with the universal ITS4 successfully amplified the DNA from all eleven tested oomycete species from six genera. High throughput sequencing of 20 soil samples from forest nurseries and bordering areas, using the primer pair ITS1oo/ITS4, recovered more than 400 oomycete OTUs, which is a significant increase over previous studies, and indicates the ability of the new method to detect various oomycete groups from complex substrates. The average fraction of oomycete reads per soil samples was 32–36%, with a maximum of 69%. The recovered oomycete OTUs represented the groups Lagenidiales, Peronosporales, Pythiales and Saprolegniales, with Pythiales dominating in all samples. In addition, the new primers were successfully used in identifying pathogens directly from infected plant tissues with Sanger sequencing. The pathogen was identified to the species or genus level in four samples out of six. In conclusion, the developed oomycete-specific primers provide a reliable method for the identification and metabarcoding of oomycetes.
Key words
oomycete, community barcoding, next generation sequencing, ITS, community analysis, soil community
Introduction
Oomycetes are microscopic stramenopiles that are found in both aquatic and terrestrial environments (
Of oomycete-specific ITS primers, ITS6 and ITS7 (
Another oomycete-specific ITS primer, the ITS-O, has been published by
The aim of the current study was to develop new oomycete ITS primers with improved taxon coverage and specificity for use in community-level studies. In order to reduce material costs, we decided to develop two oomycete specific forward primers that can be combined with various universal reverse primers. The new and existing primers were analyzed in silico to evaluate the coverage and specificity of the primers and the primers selected as suitable for oomycete ITS barcoding were tested in vitro on cultures, infected plant tissues and soil samples.
Methods and materials
Pure cultures of oomycetes and fungi
DNA extracts from the pure cultures of eleven oomycete species from six genera were used in testing of the primers. Additionally, DNA from the cultures of five fungal species was used to test the specificity of the primers (Table
Cultures of oomycetes and fungi that were used in testing the specificity of the new primers.
| Species | Isolation year | Strain/culture code | Host |
|---|---|---|---|
| Achlya oligochanta | 2010 | HJ33C | Astacus astacus |
| Aphanomyces astaci | 2008 | KTY3-4 | Astacus astacus |
| Aphanomyces astaci | 2003 | UEF8866-2 | Pacifastacus leniusculus |
| Aphanomyces astaci | 2014 | AT1D | Austropotamobius torrentium |
| Aphanomyces laevis | 2008 | KTY5-2 | Astacus astacus |
| Aphanomyces stellatus | 2010 | HJ38C | Astacus astacus |
| Aphanomyces salsuginosus | 2014 | NJM0912 | Salangichithys microdon |
| Phytophthora infestans | 2014 | An2-13 | n/a |
| Phytophthora infestans | 2014 | HiPa1-13 | n/a |
| Phytophthora infestans | 2014 | Ti17-13 | n/a |
| Phytophthora cactorum | 2012 | 145714 | Betula pendula |
| Pythium sp. | 2007 | T4B | Astacus astacus |
| Saprolegnia australis | 2007 | S23 | Astacus astacus |
| Saprolegnia parasitica | 2007 | S14 | Astacus astacus |
| Scoliolegnia sp. | 2007 | S16 | Astacus astacus |
| Alternaria infectoria | 2014 | TU-3 TFC 2013-46 | n/a |
| Armillaria cepistipes | 2013 | EPS 110 | Fraxinus excelsior |
| Fusarium culmorum | 2014 | KV-6 TFC 2013-54 | n/a |
| Neonectria radicicola | 2013 | EPS 82 | n/a |
| Ulocladium castanea | 2014 | CBS 124390 | n/a |
Sampling and DNA extraction
A total of 20 soil samples were collected from beds of forest nurseries and bordering control areas (Table
Soil samples used in evaluating the performance of the new oomycete specific primer pair ITS1oo/ITS4 in high-throughput sequencing.
| Sample | Geocode | Time of sampling | Sampling plot description |
|---|---|---|---|
| 1.1 | 58°48.00'N, 24°30.03'E | 10/16/2014 | 1 y/o Picea abies nursery bed |
| 1.2 | 58°48.02'N, 24°30.00'E | 10/16/2014 | Area bordering the nursery |
| 2.1 | 58°20.51'N, 24°36.58'E | 17/10/2014 | Former Picea abies nursery bed |
| 2.2 | 58°20.53'N, 24°36.42'E | 17/10/2014 | Area bordering the former nursery |
| 3.1 | 59°9.49'N, 26°16.94'E | 14/10/2014 | 2 y/o Betula pendula nursery bed |
| 3.2 | 59°9.48'N, 26°16.67'E | 14/10/2014 | Area bordering the nursery |
| 4.1 | 59°20.14'N, 26°51.37'E | 9/26/2014 | 1 y/o Picea abies nursery bed |
| 4.2 | 59°20.14'N, 26°51.36'E | 9/26/2014 | Area bordering the nursery |
| 5.1 | 59°33.77'N, 26°5.60'E | 9/25/2014 | 3 y/o Picea abies nursery bed |
| 5.2 | 59°33.76'N, 26°5.60'E | 9/25/2014 | Area bordering the nursery |
| 6.1 | 59°32.29'N, 26°16.40'E | 9/25/2014 | 1 y/o Picea abies nursery bed |
| 6.2 | 59°32.29'N, 26°16.36'E | 9/25/2014 | Area bordering the nursery |
| 7.1 | 59°12.08'N, 26°13.67'E | 11/5/2014 | 1 y/o Betula pendula nursery bed |
| 7.2 | 59°11.89'N, 26°14.40'E | 11/5/2014 | Area bordering the nursery |
| 8.1 | 56°6.22'N, 27°17.89'E | 11/6/2014 | 1 y/o Picea abies greenhouse nursery bed |
| 8.2 | 56°6.16'N, 27°17.98'E | 11/6/2014 | Area bordering the nursery |
| 9.1 | 58°2.18'N, 25°58.17'E | 11/7/2014 | 2 y/o Picea abies nursery bed |
| 9.2 | 58°2.08'N, 25°57.97’ E | 11/7/2014 | Area bordering the nursery |
| 10.1 | 58°10.46'N, 26°11.18'E | 11/7/2014 | 1 y/o Betula pendula nursery bed |
| 10.2 | 58°10.44'N, 26°11.16'E | 11/7/2014 | Area bordering the nursery |
Symptomatic plant samples with oomycete infection that were used in testing of the new primers ability to identify pathogens directly from infected plant tissues.
| Plant sample | Sampling location | Time of sampling | Host species / symptoms | Identified pathogen / sequence similarity |
|---|---|---|---|---|
| 1. | Tartu county | 06/11/2014 | Alnus incana/ bark discolouration | Phytophthora sp./ 99% |
| 2. | Tartu county | 07/09/2014 | Solanum tuberosum/ leaf rot | Phytophthora infestans/ 100% |
| 3. | Tartu county | 07/17/2014 | Aegopodium podagraria/ leaf discolouration | Plasmopara nivea/ 99% |
| 4. | Tartu county | 09/14/2014 | Solanum lycopersicum/ leaf rot | Phytophthora infestans/ 99% |
| 5. | Tartu county | 09/14/2014 | Vitis vinifera/ leaf discolouration | No result |
| 6. | Tartu county | n/a | Cucurbita pepo/ leaf discolouration | No result |
DNA was isolated from 2 g of soil with the MO BIO PowerMax Soil DNA Isolation Kit (MO BIO Laboratories, Inc., Carlsbad, CA, USA). DNA from symptomatic plant samples was isolated with the MO BIO PowerSoil DNA Isolation Kit from up to 0.2 g of material. Prior to DNA extraction, soil and tissue samples were crushed using bead beating with two 3.2 mm diameter stainless steel balls (BioSpec Products, Bartlesville, OK, USA). The 2 ml tubes containing the samples and balls were shaken for 5 min at 30 Hz with the Retsch Mixer Mill MM400 (Retsch, Haan, Germany). Pure culture DNA was extracted using a proteinase K-based method (100 µl 0.2 M (NH4)2SO4 and 2.5 µl proteinase K; incubation at 56 °C for 24 h and at 98 °C for 15 min).
Primer design
The new oomycete-specific forward primers ITS1oo and ITS3oo were selected by aligning all oomycete and other stramenopile ITS sequences present in the International Nucleotide Sequence Databases (www.insdc.org). ITS sequences were aligned with MAFFT (http://mafft.cbrc.jp/alignment/software/) and checked by using SEAVIEW software (http://doua.prabi.fr/software/seaview). Primer sequences were then selected within the desired regions by screening for segments that are conserved across all oomycetes. Specificity of the primers was analysed by running BLASTn comparisons against the INSDc and manually by comparing against a custom ITS database containing sequences of nine major eukaryotic groups (
PCR conditions and validation
PCR amplification was carried out using a reaction mixture consisting of 18 µl of PCR grade water, 5 µl of 5x HOT FIREPol Blend Mastermix (10 mM MgCl2) (OÜ Solis Biodyne, Tartu, Estonia), 0.5 µl of both primers (20 µM) and 1 µl of DNA sample. Amplifications were done with Eppendorf 5341and Eppendorf 6321 thermal cyclers (Eppendorf AG, Hamburg, Germany) by running the following programme: 15 min at 95 °C, 35 cycles of 30 s at 95 °C, 30 s at 55 °C, 1 min at 72 °C and a final cycle of 10 min at 72 °C.
The new forward primers were optimized for use with the universal reverse primer ITS4 (
Sequencing of infected plant samples
PCR products obtained from the six symptomatic plant samples were purified using to the ExoSAP method (
High-throughput sequencing of soil samples
In total, 20 soil samples were sequenced using Illumina Miseq 2x300 PE HTS technology in the Estonian Biocentre (Tartu, Estonia). Amplicons were prepared with the primers ITS1oo and ITS4ngs (
Analysis of Illumina sequencing data
Based on sequencing primers, read 1 and read 2 were shuffled to contain regions of ITS1 and ITS2, respectively (using FQGREP (https://github.com/indraniel/fqgrep)). These paired-end reads were analysed separately, because in most cases the amplified full-length ITS region exceeded 600 bp and could not be merged. Sequencing reads were quality filtered and assigned to samples using MOTHUR (
Results
Primer selection and in silico analyses
As a result of aligning all oomycete ITS sequences present in the INSDc, it was possible to choose two short regions which are conserved across the majority of oomycetes and allow for the discrimination of other taxonomic groups. The primer ITS1oo overlaps with the primer ITS-O (
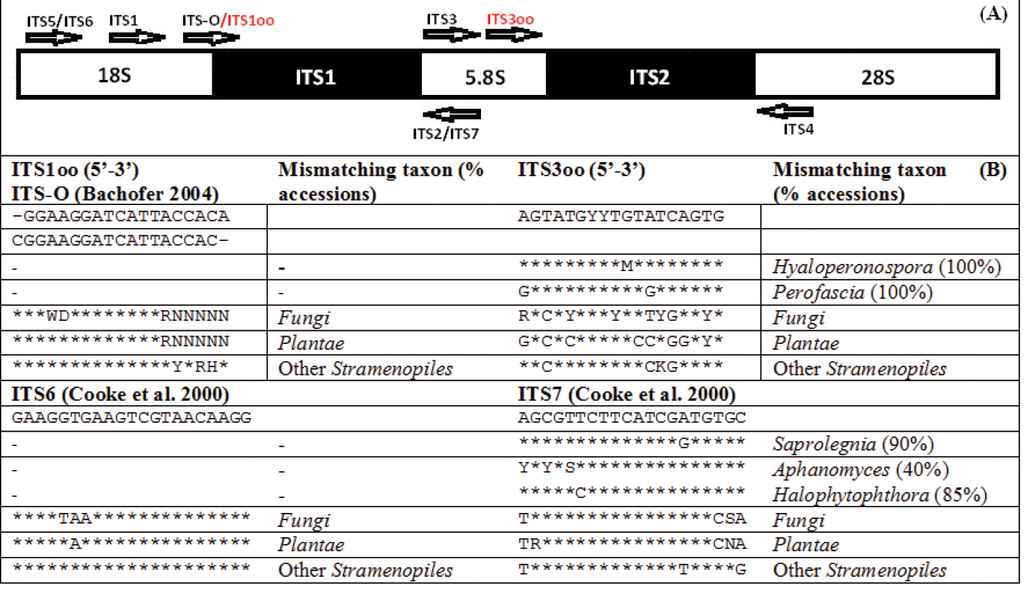
The location of the 18 bp long ITS1oo, modified from the ITS-O (
Analyses of pure culture and infected plant material
The primer pairs ITS1oo/ITS4 and ITS3oo/ITS4 produced a single amplification band of the expected length from all 15 tested oomycete strains, representing six genera (Achlya, Aphanomyces, Phytophthora, Pythium, Saprolegnia, Scoliolegnia) and eleven species. No visible bands were obtained in gel with DNA from five fungal species.
• Four samples, extracted directly from the symptomatic tissues of a grey alder (Alnus incana), a potato (Solanum tuberosum), a tomato (Solanum lycopersicum) and a goutweed (Aegopodium podagraria), produced a single amplification band with both primer pairs ITS1oo/ITS4 and ITS3oo/ITS4 and were sequenced. Sequencing of the grey alder sample was successful with the primer ITS3oo, whereas the other three samples were successfully sequenced with both ITS1oo and ITS3oo. Comparisons against the NCBI GenBank nucleotide database showed that the sequence from the first sample belongs to Phytophthora sp. (99% similarity), the sequences from the second and third samples belong to Phytophthora infestans (100% and 99% similarity) and the sequence from the goutweed sample belongs to Plasmopara nivea (99% similarity). One sample from a zucchini plant (Cucurbita pepo) and one from a grape vine (Vitis vinifera) produced multiple amplification bands of different sizes with both primer pairs and were not sequenced.
Soil sample oomycete diversity
Altogether 67133 quality filtered ITS1 reads were recovered from the 20 soil samples. In all, 281 singletons were discarded from further analyses. Nearly 66% of all reads belonged to unknown taxa, 25% to oomycetes and 9% to other taxonomic groups (Figure

OTU and read distributions of ITS1 (A) and ITS2 (B) reads. Panels starting from outermost: 1 Oomycete read distribution between orders 2 Read distribution between classes, excluding reads of unknown origin 3 Read distribution between classes, including reads of unknown origin 4 OTU distribution between classes.

For the ITS2 subregion, 77734 quality filtered reads comprised 1720 OTUs and 241 singletons. Out of all ITS2 reads, 30% were assigned to oomycetes and 8% to fungi, whereas 60% belonged to unknown taxa (Figure
Discussion
The ultimate aim of this study was to validate an alternative method for metabarcoding oomycetes in complex substrates such as soil. We developed a novel taxon-specific PCR assay for the ITS region-based identification of oomycetes. When compared with the previously developed ITS-O, ITS6 and ITS7 primers, the ITS1oo, modified from the original ITS-O (
Furthermore, the modified and newly developed forward primers are located in the very end of the conserved fragments that reduce the size of amplicons by 10-20% compared with the ITS6 forward primer, which is of great importance for HTS platforms producing short fragments such as Illumina and Ion Torrent. When combined with universal reverse primers, these oomycete-specific primers could be used in multiplex with other specific forward primers to address several taxonomic groups of pathogens simultaneously, without adding the cost of multiple barcoded reverse primers (Tedersoo et al. 2015).
Previous studies have used oomycete-specific primers ITS6 and ITS7 to amplify the ITS1 region with highly variable success. For example,
In this study, we recovered 404 ITS1-based and 493 ITS2-based oomycete OTUs from 20 soil samples from forest nurseries and bordering control areas. The number of recovered oomycete OTUs is considerably higher than in previous studies, which could be due to higher diversity in the analysed soil samples or a result of some properties of the new assay. Oomycete reads comprised on average 32% and 36% of the total reads of individual soil samples for ITS1 and ITS2, respectively. The assigned oomycete OTUs belonged to the orders of Lagenidiales, Peronosporales, Pythiales and Saprolegniales, confirming the ability of the proposed new assay to detect various oomycete groups from complex samples. Pythiales were found to be dominating in the soil samples, making up nearly 50% of the total oomycete reads, a result that is in line with previous oomycete community studies (
The new primers were also used to identify oomycete pathogens from infected plant samples by using Sanger sequencing. The pathogens were successfully determined in four samples out of six. Sequencing was successful with both ITS1oo and ITS3oo from a goutweed (Aegopodium podagraria), a potato (Solanum tuberosum) and a tomato (Solanum lycopersicum) sample, whereas in the case of a grey alder (Alnus incana) sample only ITS3oo produced an identifiable sequence. This could indicate a somewhat higher specificity of ITS3oo in comparison to ITS1oo in some cases when identifying pathogens from infected plant material. Two samples out of six produced multiple amplification bands, possibly indicating the presence of several oomycete species in the infected sample. This result shows that the new primers can be used to detects oomycete pathogen species directly from infected plant samples in cases where the infected tissue in dominated by one pathogen, without co-amplification of plant and fungal DNA.
Taken together, we provide highly oomycete-specific forward primers that can be used in combination with previously developed oomycete-specific or universal reverse primers. Considering the rapid evolution of high-throughput sequencing, the full ITS sequence is certainly preferable over ITS1 or ITS2 used alone, because these subregions may differ in the taxonomic resolution across genera.
Acknowledgements
We thank Dr. Jenny Makkonen (University of Eastern Finland) for oomycete pure culture DNA samples and Eda Tetlov (Environmental Board of Estonia) for forest nursery soil samples. This study was funded from Estonian Science Foundation grant PUT0171, SNS-117, the Norwegian Financial Mechanism 2009-2014 under the projects EMP162 and EMP265, and by the Institutional Research Funding IUT21-04 and IUT36-2.
References
- Acinas SG, Sarma-Rupavtarm R, Klepac-Ceraj V, Polz MF (2005) PCR-induced sequence artifacts and bias: insights from comparison of two 16S rRNA clone libraries constructed from the same sample. Applied and Environmental Microbiology 71: 8966–8969. doi: 10.1128/AEM.71.12.8966-8969.2005
- Arcate JM, Karp MA, Nelson EB (2006) Diversity of Peronosporomycete (oomycete) communities associated with the rhizosphere of different plant species. Microbial Ecology 51: 36–50. doi: 10.1007/s00248-005-0187-y
- Bachofer M (2004) Molekularbiologische Populationsstudien an Plasmopara halstedii, dem Falschen Mehltau der Sonnenblume Dissertation, Universitat Hohenheim Germany, 1–140.
- Bell J (2008) A simple way to treat PCR products prior to sequencing using ExoSAP-IT. Biotechniques 44: 834. doi: 10.2144/000112890
- Bengtsson-Palme J, Ryberg M, Hartmann M, Branco S, Wang Z, Godhe A, De Wit P, Sánchez-García M, Ebersberger I, de Sousa F, Amend A, Jumpponen A, Unterseher M, Kristiansson E, Abarenkov K, Bertrand YJK, Sanli K, Eriksson KM, Vik U, Veldre V, Nilsson RH (2013) Improved software detection and extraction of ITS1 and ITS2 from ribosomal ITS sequences of fungi and other eukaryotes for analysis of environmental sequencing data. Methods in Ecology and Evolution 4: 914–919. doi: 10.1111/2041-210X.12073
- Cha RS, Thilly WG (1993) Specificity, Efficiency, and Fidelity of PCR. Genome Research 3: S18–S29. http://genome.cshlp.org/content/3/3/S18.long
- Choi Y-J, Beakes G, Glockling S, Kruse J, Nam B, Nigrelli L, Ploch S, Shin H-D, Shivas RG, Telle S, Voglmayr H, Thines M (2015) Towards a universal barcode of oomycetes – a comparison of the cox1 and cox2 loci. Molecular Ecology Resources 15: 1275–1288. doi: 10.1111/1755-0998.12398
- Coince A, Cael O, Bach C, Lengelle J, Cruaud C, Gavory F, Morin E, Murat C, Marcais B, Buee M (2013) Below-ground fine-scale distribution and soil versus fine root detection of fungal and soil oomycete communities in a French beech forest. Fungal Ecology 6: 223–235. doi: 10.1016/j.funeco.2013.01.002
- Cooke DEL, Drenth A, Duncan JM, Wagels G, Brasier CM (2000) A molecular phylogeny of Phytophthora and related oomycetes. Fungal Genetics and Biology 30: 17–32. doi: 10.1006/fgbi.2000.1202
- Dick MW (2001) Straminipilous fungi. Kluwer Academic Publishers, 1–670. doi: 10.1007/978-94-015-9733-3
- Edgar RC (2010) Search and clustering orders of magnitude faster than BLAST. Bioinformatics 26(19): 2460–1. doi: 10.1093/bioinformatics/btq461
- Herrero ML, Toppe B, Brurberg MB (2011) First report of Phytophthora ramorum causing shoot dieback on bilberry (Vaccinium myrtillus) in Norway. Plant Disease 95(3): 355. doi: 10.1094/PDIS-10-10-0709
- Hudspeth DSS, Nadler SA, Hudspeth MES (2000) A cox2 phylogeny of the Peronosporomycetes (Oomycetes). Mycologia 92: 674–684. doi: 10.2307/3761425
- Hyde KD, Henrik Nilsson R, Aisyah Alias S, Ariyawansa HA, Blair JE, Cai L, de Cock WAMA, Dissanayake AJ, Glockling SL, Goonasekara ID, Gorczak M, Hahn M, Jayawardena RS, van Kan JAL, Laurence MH, André Lévesque C, Li X, Liu J-K, Maharachchikumbura SSN, Manamgoda DS, Martin FN, McKenzie EHC, McTaggart AR, Mortimer PE, Nair PVR, Pawłowska J, Rintoul TL, Shivas RG, Spies CFJ, Summerell BA, Taylor PWJ, Terhem RB, Udayanga D, Vaghefi N, Walther G, Wilk M, Wrzosek M, Xu J-C, Yan JY, Zhou N (2014) One stop shop: backbones trees for important phytopathogenic genera: I. Fungal Diversity 67: 21–125. doi: 10.1007/s13225-014-0298-1
- Innis MA, Gelfand DH, Sninsky JJ, White TJ (1990) PCR Protocols A Guide to Methods and Applications. Academic Press, 1–482. doi: 10.1016/0167-7799(90)90215-J
- Ishii K, Fukui M (2001) Optimization of annealing temperature to reduce bias caused by a primer mismatch in multitemplate PCR. Applied and Environmental Microbiology 67(8): 3753–5. doi: 10.1128/AEM.67.8.3753-3755.2001
- Kamoun S (2003) Molecular genetics of pathogenic oomycetes. Eukaryotic Cell 2: 191–199. doi: 10.1128/EC.2.2.191-199.2003
- Karling JS (1981) Predominantly holocarpic and eucarpic simplebiflagellate phycomycetes. J Cramer, Vaduz, 1–252.
- Kwok S, Kellogg DE, McKinney N, Spasic D, Godal L, Levenson C, Sninsky JJ (1990) Effects of primer-template mismatches on the polymerase chain reaction: human immunodeficiency virus type 1 model studies. Nucleic Acids Research 18: 999–1005. http://www.ncbi.nlm.nih.gov/pmc/articles/PMC330356/pdf/nar00188-0292.pdf
- Li W, Godzik A (2006) Cd-hit: a fast program for clustering and comparing large sets of protein or nucleotide sequences. Bioinformatics 22(13): 1658–9. doi: 10.1093/bioinformatics/btl158
- Robideau GP, De Cock AW, Coffey MD, Voglmayr H, Brouwer H, Bala K, Chitty DW, Désaulniers N, Eggertson QA, Gachon CM, Hu CH, Küpper FC, Rintoul TL, Sarhan E, Verstappen EC, Zhang Y, Bonants PJ, Ristaino JB, Lévesque CA (2011) DNA barcoding of oomycetes with cytochrome c oxidase subunit I and internal transcribed spacer. Molecular Ecology Resources 11(6): 1002–1011. doi: 10.1111/j.1755-0998.2011.03041.x
- Sapkota R, Nicolaisen M (2015) An improved high throughput sequencing method for studying oomycete communities. Journal of Microbiological Methods 110: 33–39. doi: 10.1016/j.mimet.2015.01.013
- Sipos R, Székely AJ, Palatinszky M, Révész S, Márialigeti K, Nikolausz M (2007) Effect of primer mismatch, annealing temperature and PCR cycle number on 16S rRNA gene-targetting bacterial community analysis. FEMS Microbiology Ecology 60: 341–350. doi: 10.1111/j.1574-6941.2007.00283.x
- Schloss PD, Westcott SL, Ryabin T, Hall JR, Hartmann M, Hollister EB, Lesniewski RA, Oakley BB, Parks DH, Robinson CJ, Sahl JW, Stres B, Thallinger GG, Van Horn DJ, Weber CF (2009) Introducing mothur: open-source, platform-independent, community-supported software for describing and comparing microbial communities. Applied and Environmental Microbiology 75(23): 7537–41. doi: 10.1128/AEM.01541-09
- Schmidt P-A, Bálint M, Greshake B, Bandow C, Römbke J, Schmitt I (2013) Illumina metabarcoding of a soil fungal community. Soil Biology and Biochemistry 65: 128–132. doi: 10.1016/j.soilbio.2013.05.014
- Sparrow FK (1960) Aquatic Phycomycetes, 2nd revised edition. University of Michigan Press, Ann Arbor, 1–1187. https://archive.org/stream/aquaticphycomyce00spar/aquaticphycomyce00spar_djvu.txt
- Sparrow FK (1976) The present status of classification in biflagellate fungi. In: Gareth-Jones EB (Eds) Recent advances in aquatic mycology. Elek Science, London, 213–222. doi: 10.1002/jobm.19790190115
- Spring O, Bachofer M, Thines M, Riethmüller A, Göker M, Oberwinkler F (2006) European Journal of Plant Pathology 114: 309. doi: 10.1007/s10658-005-5996-9
- Tedersoo L, Bahram M, Cajthaml T, Põlme S, Hiiesalu I, Anslan S, Harend H, Buegger F, Pritsch K, Koricheva J, Abarenkov K (2016) Tree diversity and species identity effects on soil fungi, protists and animals are context-dependent. ISME Journal 10: 346–362. doi: 10.1038/ismej.2015.116
- Tedersoo L, Bahram M, Põlme S, Kõljalg U, Yorou NS, Wijesundera R, Villarreal Ruiz L, Vasco-Palacios AM, Thu PQ, Suija A, Smith ME, Sharp C, Saluveer E, Saitta A, Rosas M, Riit T, Ratkowsky D, Pritsch K, Põldmaa K, Piepenbring M, Phosri C, Peterson M, Parts K, Pärtel K, Otsing E, Nouhra E, Njouonkou AL, Nilsson RH, Morgado LN, Mayor J, May TW, Majuakim L, Lodge DJ, Lee SS, Larsson KH, Kohout P, Hosaka K, Hiiesalu I, Henkel TW, Harend H, Guo LD, Greslebin A, Grelet G, Geml J, Gates G, Dunstan W, Dunk C, Drenkhan R, Dearnaley J, De Kesel A, Dang T, Chen X, Buegger F, Brearley FQ, Bonito G, Anslan S, Abell S, Abarenkov K (2014) Global diversity and geography of soil fungi. Science 346(6213): 1078. doi: 10.1126/science.1256688
- Thines M (2007) Characterisation and phylogeny of repeated elements giving rise to exceptional length of ITS2 in several downy mildew genera (Peronosporaceae). Fungal Genetics and Biology 44(3): 199-207. doi: 10.1016/j.fgb.2006.08.002
- Vannini A, Bruni N, Tomassini A, Franceschini S, Vettraino AM (2013) Pyrosequencing of environmental soil samples reveals biodiversity of the Phytophthora resident community in chestnut forests. FEMS Microbiology Ecology 85(3): 433–42. doi: 10.1111/1574-6941.12132
- Vettraino AM, Bonants P, Tomassini A, Bruni N, Vannini A (2012) Pyrosequencing as a tool for the detection of Phytophthora species: error rate and risk of false Molecular Operational Taxonomic Units. Letters in Applied Microbiology 55(5): 390–6. doi: 10.1111/j.1472-765x.2012.03310.x
- White TJ, Bruns TD, Lee SB, Taylor JW (1990) Amplification and direct sequencing of fungal ribosomal RNA genes for phylogenetics. In: Innis MA, Gelfand DH, Sninsky JJ, White TJ (Eds) PCR protocols: a guide to methods and applications. Academic Press, New York, 315–322. doi: 10.1016/B978-0-12-372180-8.50042-1